
In our last blog post we presented data from a SmogOff co-location exercise with a Cornwall Council reference station. This revealed that the data collected by our SmogOff sensor matched the reference station quite well. We have since made two more SmogOff circuits, and we wanted to check whether there was variation among our three SmogOff circuits in both their particulate matter (PM) and nitrogen dioxide (NO2) readings. To do this we ran tests with all three sensors set up alongside each other, both indoors and out on the street.
Indoor test
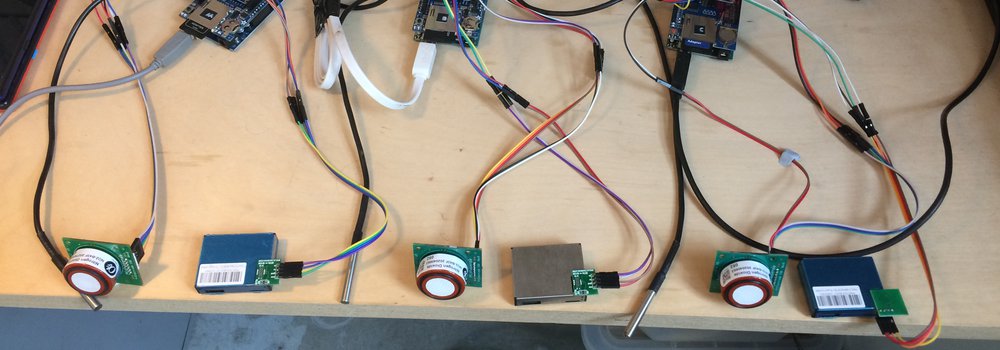
We first ran a test in our studio, where we expect air pollution levels to be relatively low and stable over the course of the day. The three sensor circuits (labelled A, B, and C) were set up on a desk within about a metre of each other, with each of the sensor components at the same height and orientated in the same direction. We ran the test for approximately 8 hours (from around 09:45 to 17:45).
Results of indoor test
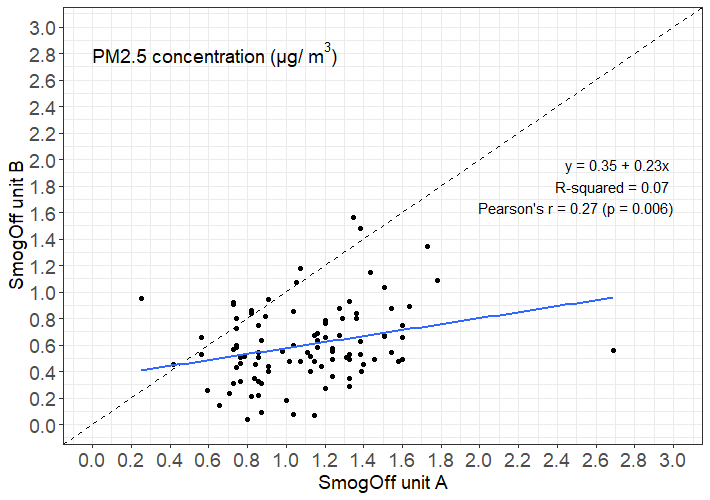
For PM, the three circuits estimated similarly low levels of PM (mean PM over monitoring period; A = 1.1 μg/m3, B = 0.6 μg/m3, C = 0.4 μg/m3). SmogOff unit A’s readings were slightly higher than the other two sensors, which were more closely matched. The correlation among each of the sensors in their 15-minute mean PM readings was moderate. This may be because PM levels indoors were fairly stable and low-level, and we expected the PM readings to correlate better when the sensors are subjected to a wider range of PM concentrations when being used outdoors.
For NO2, we removed data before 11am as the sensors require a warm up period before the NO2 data can be trusted. The three circuits produced similar readings (mean NO2 over monitoring period; A = -3.5 μg/m3, B = -6.7 μg/m3, C = -6.6 μg/m3). As with the PM readings, SmogOff circuit A produced slightly higher readings than circuits B and C. Note that the means are negative values due to the analogue nature of the NO2 sensors. However, as these were indoor tests, we expect these low negative values for the means to be close to zero (i.e. just a case of calibration and not an issue for these comparisons). There was also a strong correlation among each of the SmogOff units in their 15-minute mean NO2.
Outdoor test
We also ran tests outdoors, where there is greater variation in air pollution concentrations and ambient conditions (e.g. temperature). This was important, as it is possible that changes in temperature could affect each of the circuits differently, or that there could be greater variation among sensor readings across a wider range of pollutant concentrations.
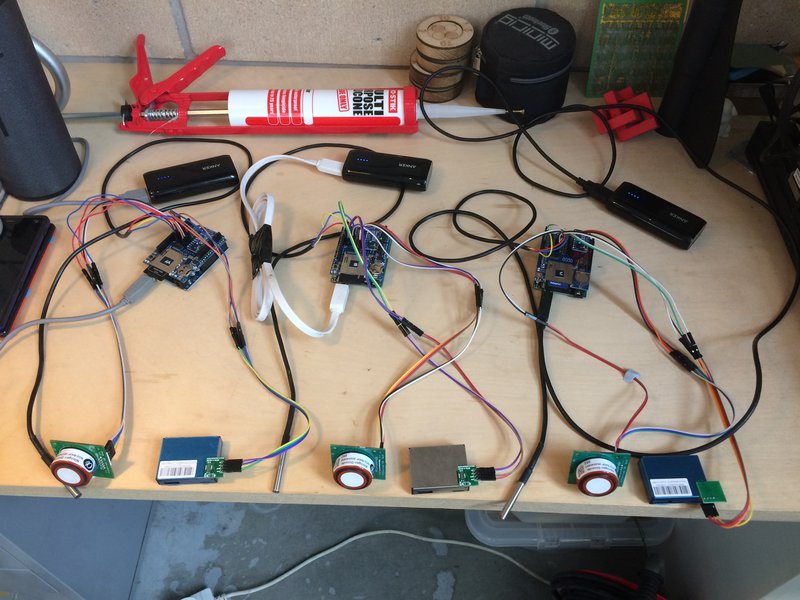
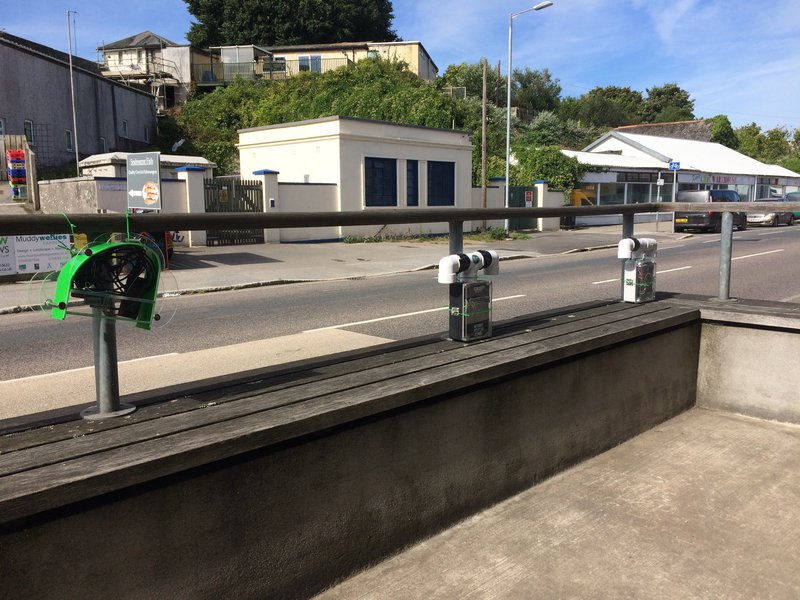
We set up three SmogOff sensors outside our studio in Penryn next to a busy road. Two circuits (A and B) were housed in our first prototype housing (plastic enclosures with plumbing pipes), while the third (C) was housed in our prototype cloud-shaped housing. The sensors were placed at similar heights and orientations next to the road, within a few metres of each other. We ran the test for approximately 7 hours (from around 10:30 to around 17:30).
Results of outdoor test
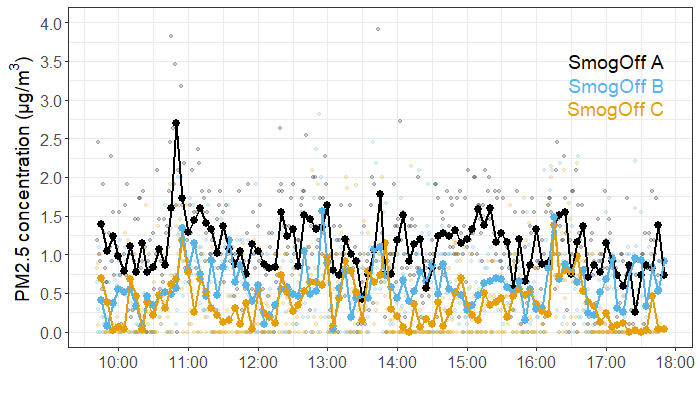
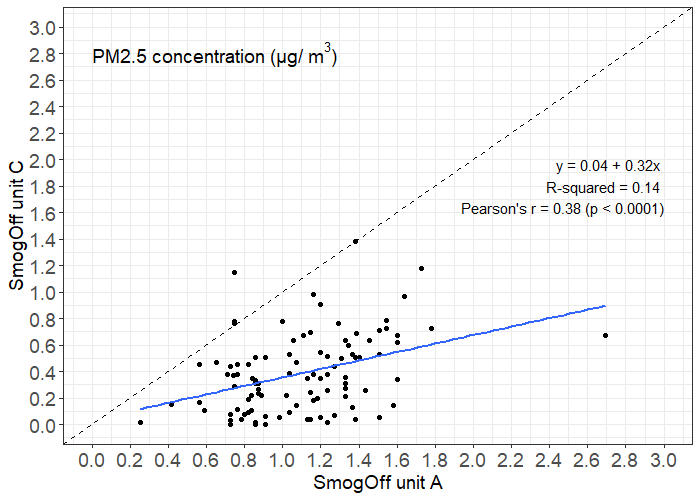
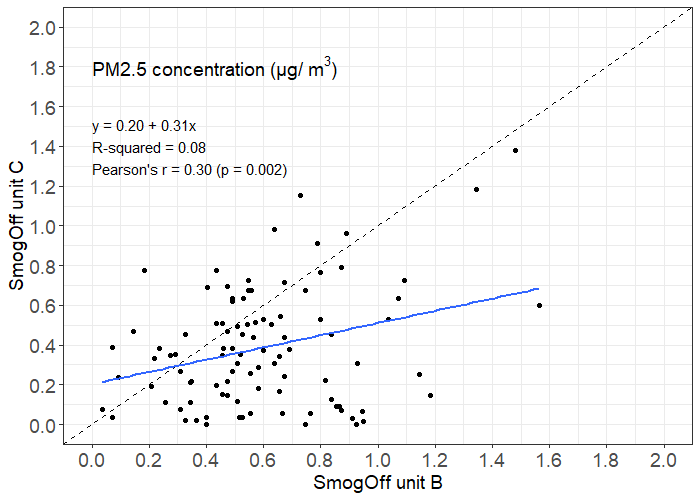
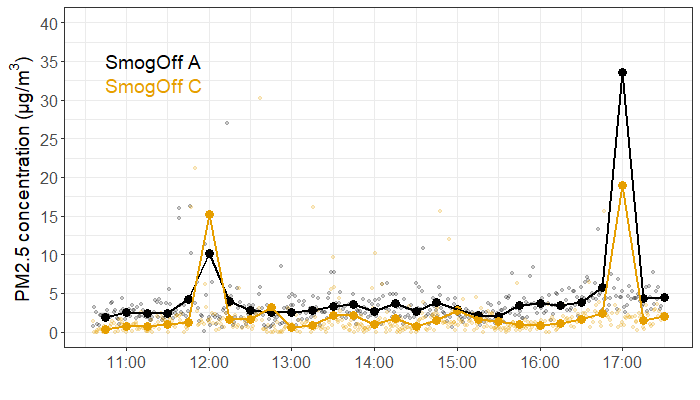
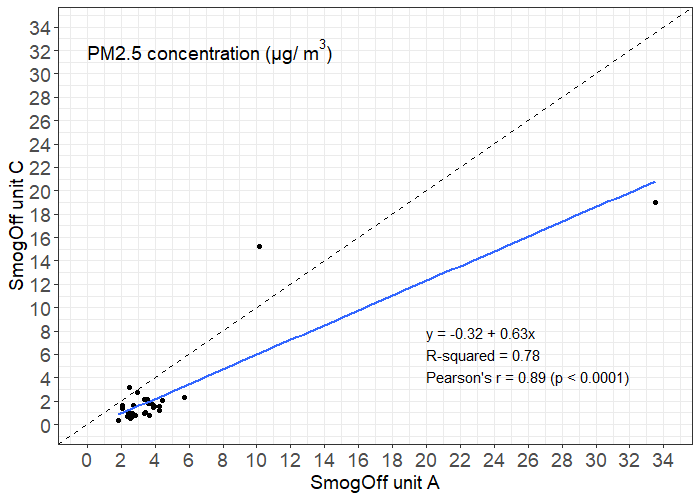
A technical issue (perhaps a loose jump cable) meant that no PM data was logged for SmogOff circuit B. The other two SmogOff units however produced similar PM readings in the outdoor test, with unit A logging slightly higher than SmogOff C (mean PM over monitoring period; A = 4.6 μg/m3, C = 2.4 μg/m3). However, both circuits’ 15-minute mean readings tracked each other very well, with both units showing large spikes at 12:00 and 17:00. There was a strong correlation between the 15-minute mean PM readings for SmogOff units A and C.
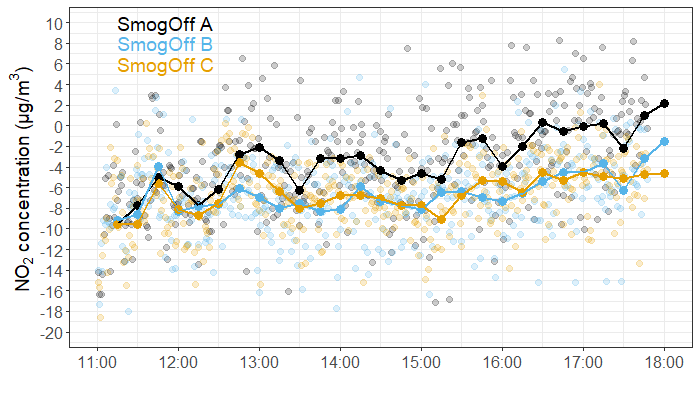
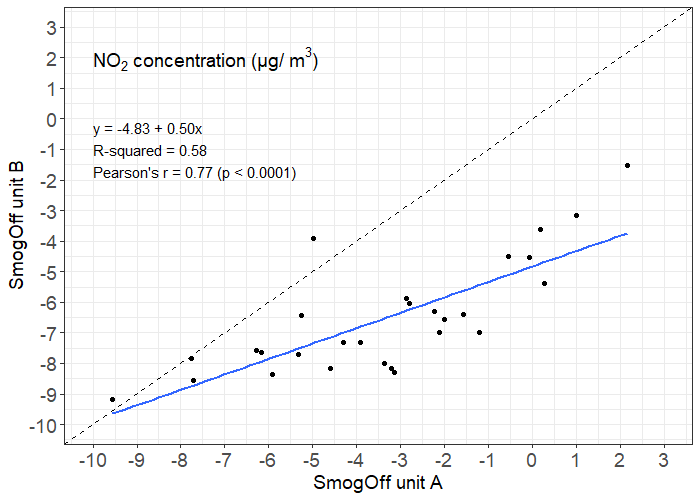
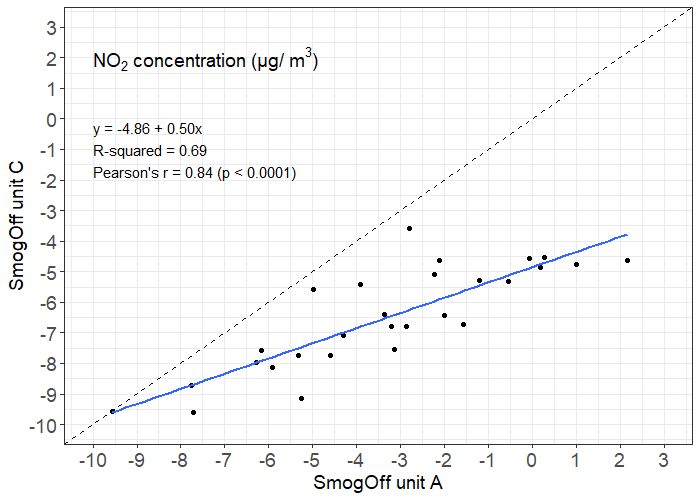
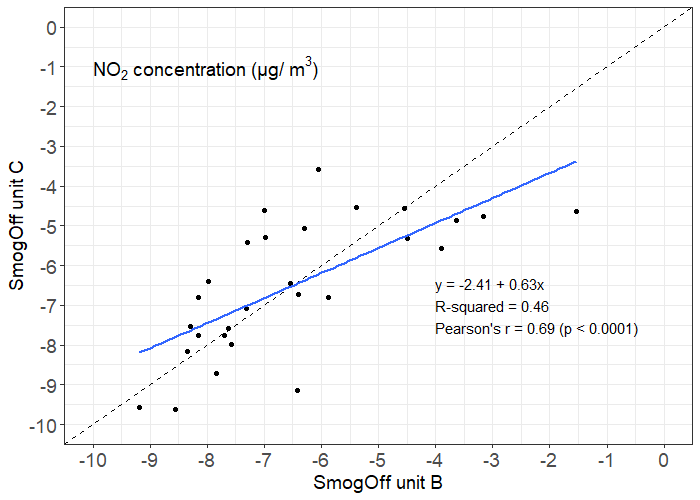
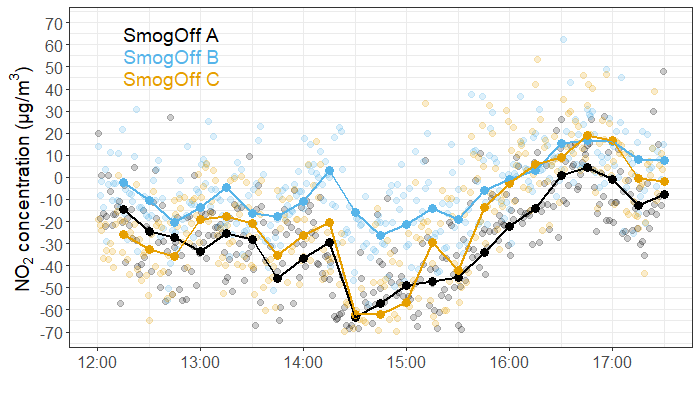
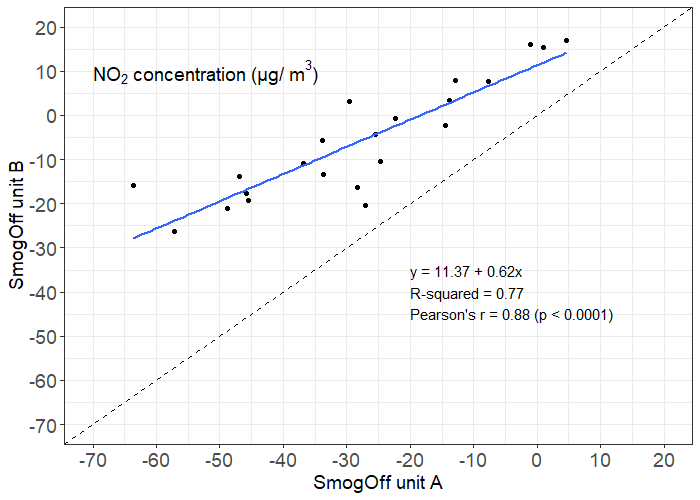
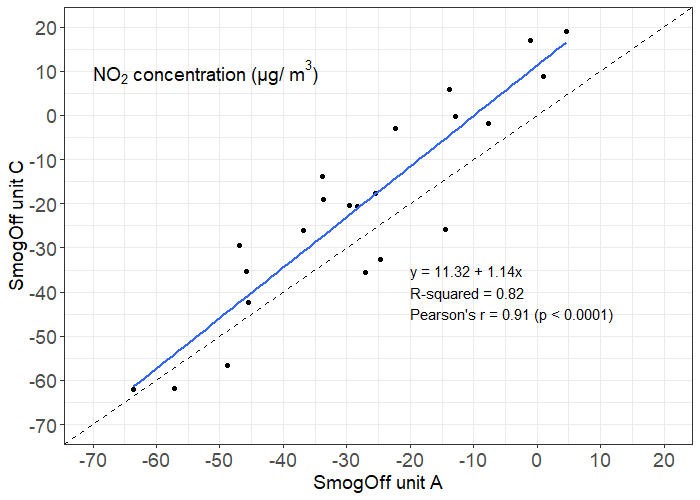
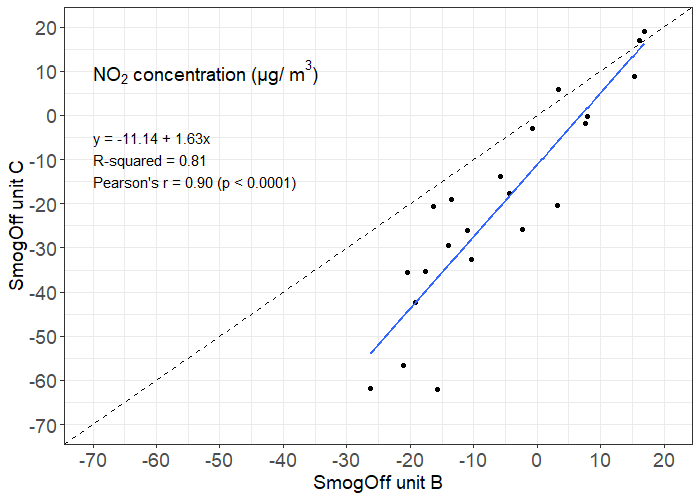
For NO2, we removed data before 12pm to allow for the warm up period). There was some variation among sensors in mean NO2 recorded over the monitoring period (A = -27.8 μg/m3, B = -5.8 μg/m3, C = -20.8 μg/m3). Despite this, all three sensors tracked each other quite well in their NO2 readings and showed strong correlations.
Overall our results suggest that there is good agreement among the sensors in the readings they produce. While individual circuits may estimate slightly higher or lower values for PM and NO2 compared to the other circuits, they all seem to similarly track fluctuations (i.e. increases and decreases) in air pollution concentrations.