
We are continuing to develop a low-cost, open source air pollution sensor. This began as a Smartline In Residence project last year, and is now continuing with support from a grant awarded by the Biotechnology and Biological Sciences Research Council (BBSRC). In this post, I will run through the recent developments since our last notes post on this project in December 2021. All code and data for this project can be found on our Gitlab.
Choosing a nitrogen dioxide (NO2) sensor
Last year we built two prototypes, each measuring two pollutants that pose serious health risks, nitrogen dioxide (NO2) and particulate matter (PM). Both prototypes had the same PM sensor (the Plantower PMS7003) but different NO2 sensors (one was fitted with an Alphasense NO2-B43F, the other with a SPEC Sensors ULPSM-NO2). Our initial tests at the end of 2021 suggested that the Alphasense sensor produced more stable readings across testing days, and seemed to be outputting more realistic values than the SPEC sensor. Additional testing in March this year, on the busy road in front of our studio, led us to the same conclusions (Figures 1 and 2). The SPEC sensor also had a more complicated setup procedure (see previous development notes for details), which involved removing the sensor component to record a ‘zero’ value before plugging it back into the module at the start of each setup. We therefore decided to use the Alphasense NO2 sensor in our future prototypes and testing.
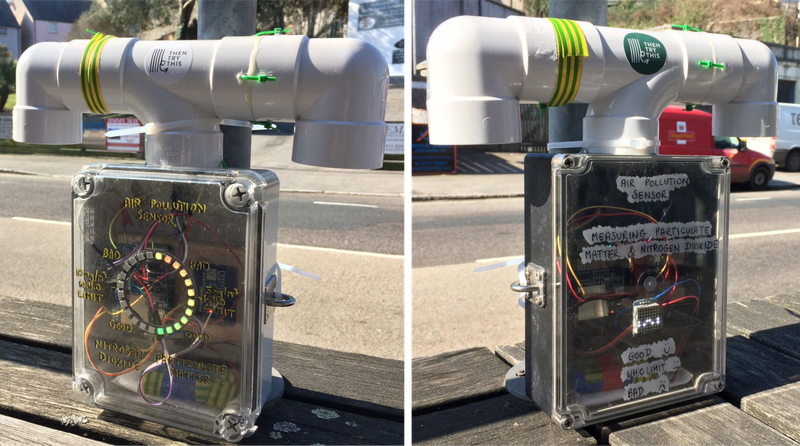
Figure 1. Two prototype SmogOff sensors recording PM2.5 and NO2 on a busy road. Each prototype also had LED displays for real-time data visualisation.
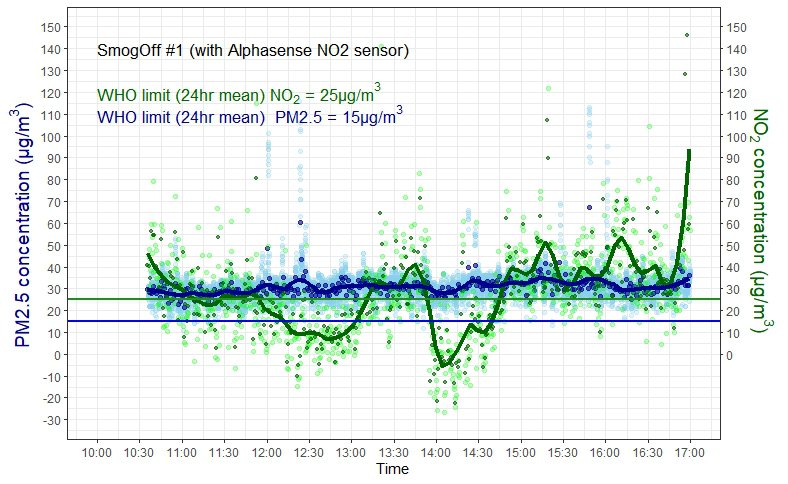
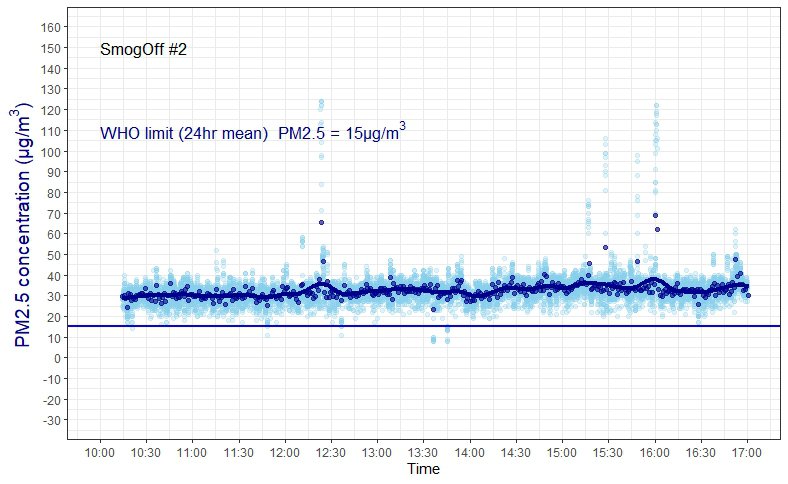
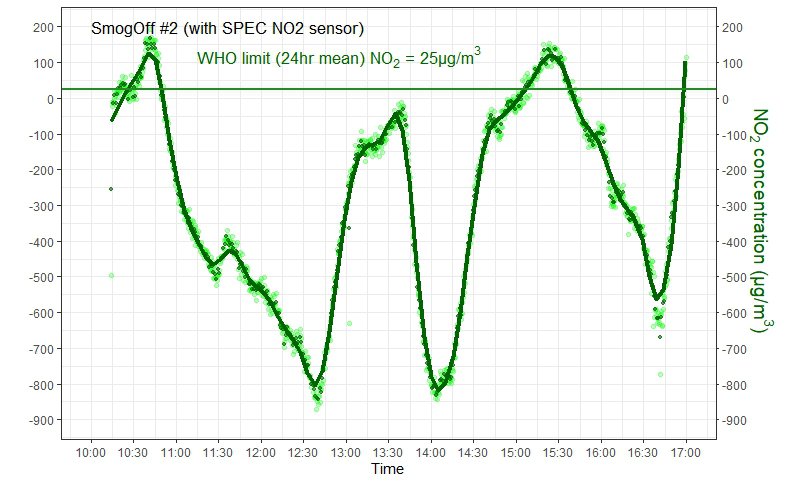
Figure 2. Plots showing data collected by two prototype sensors co-located on the same day. Transparent points are raw data and solid points are averages per minute. Lines through data points are smoothed regression lines. The first plot shows the PM2.5 and NO2 data collected by the device fitted with the Alphasense sensor. The second and third plots show the PM2.5 and NO2 data collected by the device with the SPEC NO2 sensor. Both devices were fitted with the same PM sensor (Plantower PMS7003), and the PM readings from the two different devices show strong agreement. However, the Alphasense sensor produced more realistic readings than the SPEC sensor for NO2. The first hour of data was removed as the sensors require a warm up period.
Increasing the resolution of NO2 readings with a 16-bit analogue-to-digital converter
Following these tests, we wanted to increase the resolution of our NO2 readings. The signal from analogue sensors like the Alphasense NO2 sensor are a continuous voltage range, which must be converted to a digital signal (discrete values across the voltage range, arranged in bits and bytes) in order to successfully communicate with the Arduino Uno microcontroller (SmogOff’s brain). The Arduino Uno has an inbuilt 10-bit analogue-to-digital converter (ADC), which means that it is capable of converting a continuous voltage range into 210 (= 1024) discrete voltage ‘steps’. As the system runs on 5V, this represents 1024 values between 0 and 5V (i.e. each step has a voltage range of 5000mV / 1024 = 4.88mV). However, others using these sensors have suggested reading at 16-bit resolution. For this purpose we added a 16-bit ADC (Adafruit ADS1115) to the circuit. This converts a continuous voltage range into 216 (= 65536) discrete values between 0 and 5V (i.e. each step has a voltage range of 5000mV / 65536 = 0.076mV), providing much more accurate readings.
After making some tweaks to the software to incorporate the new ADC (making use of the <Adafruit_ADS1X15.h> Arduino library), we tested the prototype again on a busy road outside our studio and next to an estuary on the opposite side of the building. These tests indicated that the NO2 sensor was giving plausible readings, with higher values on the busy road than by the estuary (Figure 3).
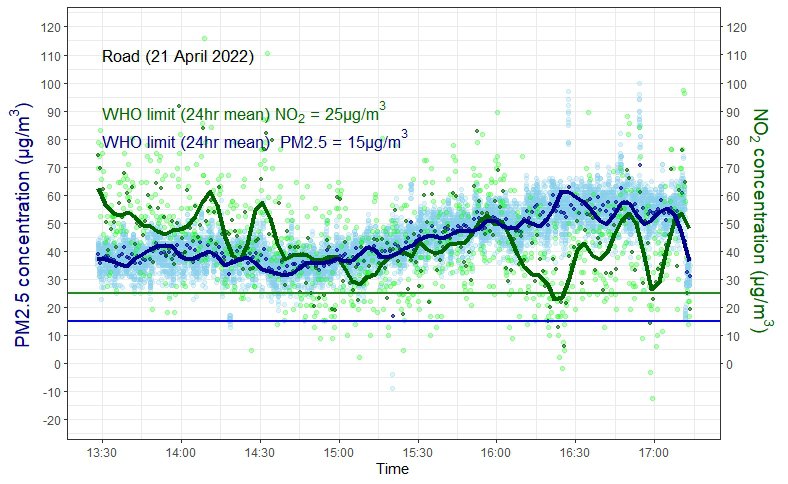
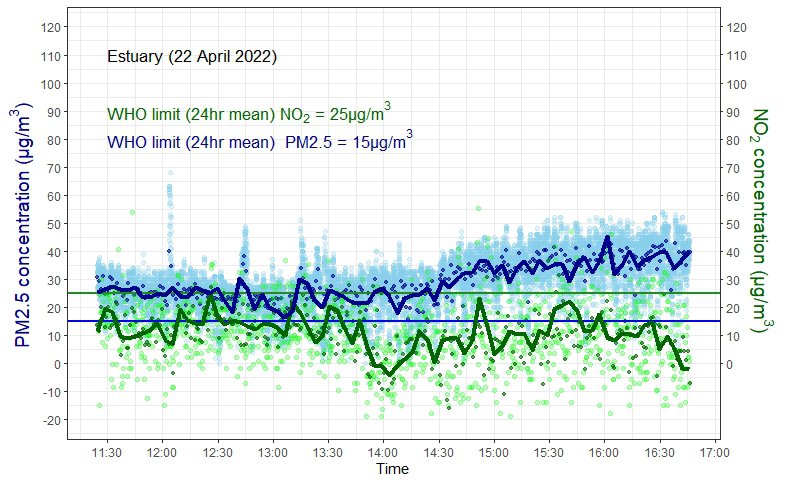
Figure 3. Plots showing data from two different days using the same SmogOff prototype. Transparent points are raw data and solid points are averages per minute. Lines through data points are smoothed regression lines. Higher levels of NO2 were recorded during the test by the road compared with the test by the estuary (although these data were collected on different days and therefore the difference could be due to daily variation in pollution levels). PM2.5 was high both by the road and by the estuary. The first hour of data was removed as the sensors require a warm up period.
Temperature sensitivity and correction algorithms
Electrochemical sensors (like the Alphasense NO2 sensor) tend to be sensitive to both temperature and humidity. We decided to explore how variation in ambient temperature affected our NO2 readings, and ways to correct for such effects. We started by examining the data from our tests in March 2022, comparing the data from the inbuilt temperature sensor in the SPEC sensor with the NO2 readings from the Alphasense sensor. If we transform the temperature and NO2 values to the same scale and plot them against each other, they appear to be inversely related (Figure 4; increases in temperature are coupled with a decrease in NO2). This could plausibly reflect (i) a causal relationship between temperature and levels of NO2 in the air (e.g. higher temperatures might somehow reduce the amount of NO2 in the air), (ii) a non-causal relationship between temperature and NO2 (e.g. NO2 levels in the air are correlated with temperature), or alternatively (iii) the effects of temperature on the circuit (i.e. the NO2-temperature relationship does not reflect temperature effects on/correlations with actual NO2 levels in the air, and is instead an artefact of temperature effects on voltages within the circuit). We want to be able to control for this third possibility as much as possible to maximise the accuracy of our readings.
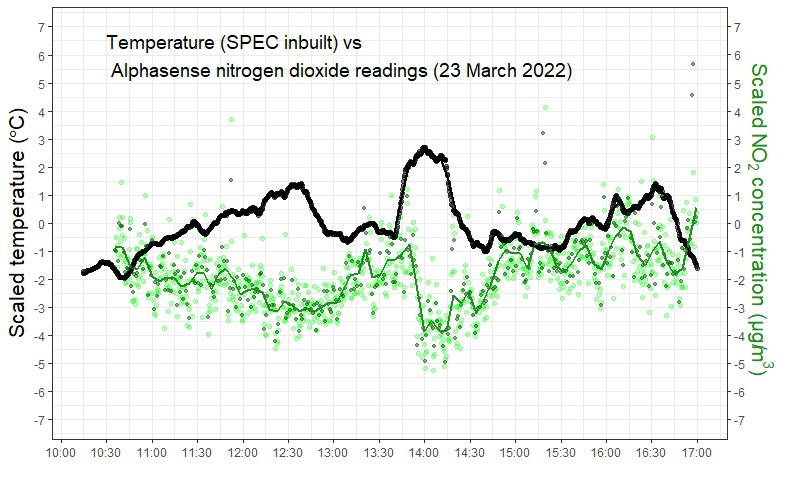
Figure 4: Scaled NO2 readings from Alphasense sensor versus scaled temperature readings from SPEC sensor. For NO2, transparent points are raw data and solid points are averages per minute. Lines through data points are smoothed regression lines. NO2 and temperature appear to be negatively correlated. The first hour of data was removed as the sensors require a warm up period.
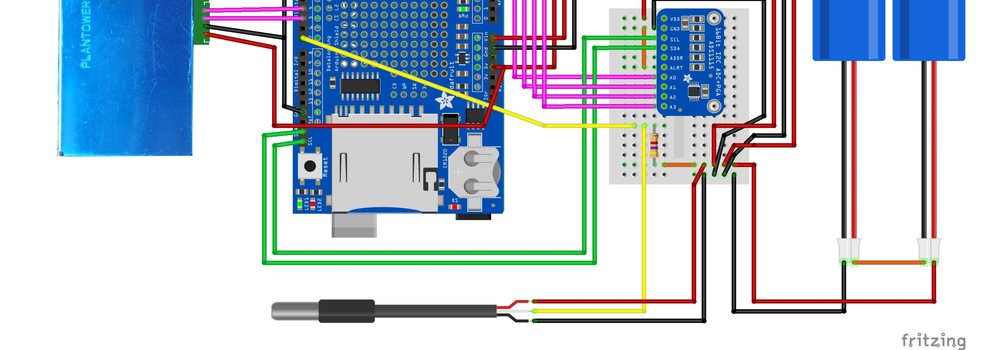
We decided to add a standalone DS18B20 temperature sensor to our SmogOff circuit in order to monitor ambient temperature variation and allow us to explore various methods of temperature-correcting the NO2 data in future tests. We made use of the <OneWire.h> Arduino library (as the temperature sensor uses a 1-wire as opposed to an i2c communication protocol) and <DallasTemperature.h> Arduino library in the firmware to get the DS18B20 temperature sensor working. The DS18B20 also requires a pull-up resistor between VCC (i.e. power supply) and DATA, which we also added to the circuit. See Figure 5 below for a complete schematic of the SmogOff system.
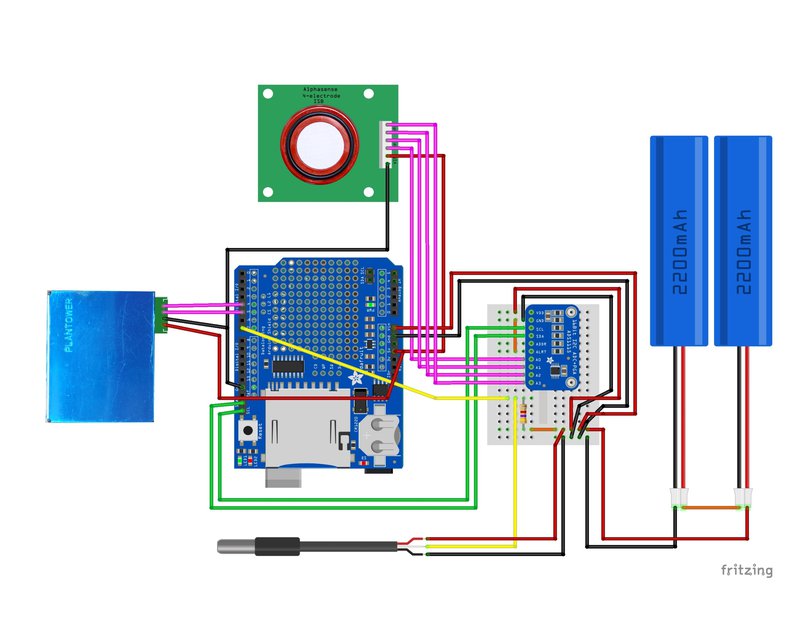
Figure 5. SmogOff “smoglet” V1.2. Our previous version also included real-time data visualisation, which we removed to maximise battery life for our testing and calibration steps.
Data from our tests in April (with the DS18B20 temperature sensor now in the circuit) further confirmed that fluctuations in temperature seemed to be affecting the NO2 readings to some extent (Figure 6). After a bit of research on the Alphasense sensors, we found that others (Wei et al. 2018; Samad et al. 2020) had also identified this issue and developed algorithms to correct for temperature variation. However, the algorithms developed were based on initial laboratory calibrations using known concentrations of target gases, which are not feasible for us to do.
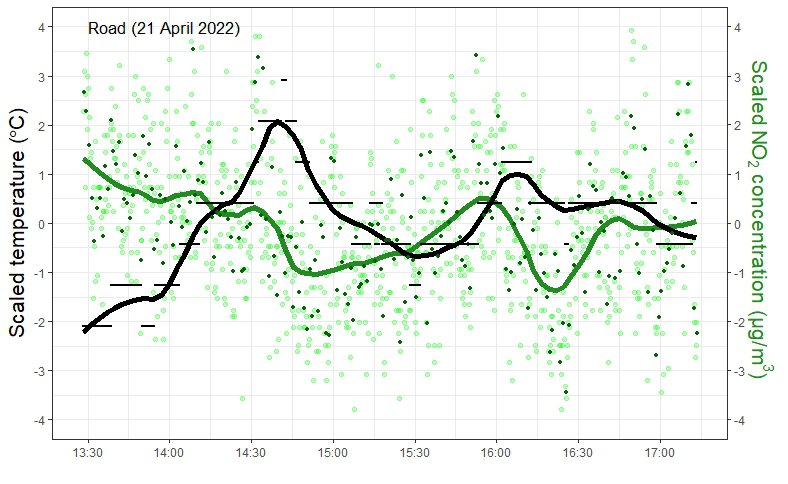
Figure 6. Scaled NO2 readings from Alphasense sensor versus scaled readings from DS18B20 temperature sensor. For NO2, transparent points are raw data and solid points are averages per minute. Lines through data points are smoothed regression lines. The raw temperature data is steppy as I had not set the resolution high enough (only measured to nearest 0.5°C), which we then corrected in the Arduino code. The first hour of data was removed as the sensors require a warm up period.
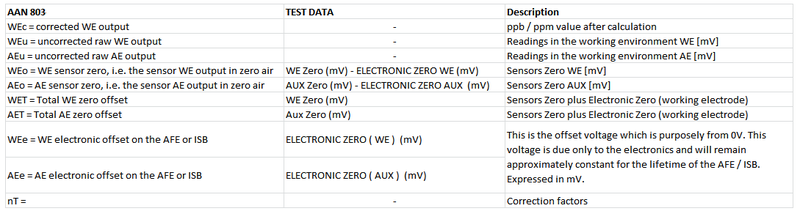
We contacted Alphasense and they provided us with a useful application note with suggestions on how to correct for the effects of ambient temperature variation. Each Alphasense sensor is tested at the factory and shipped with a list of values that are specific to that particular sensor (see below). These values are used to calculate NO2 concentration.
Note: to obtain NO2 values from the Alphasense sensor we measure the voltage differential across two electrodes; the working electrode (WE; which actually senses the target gas NO2) and the auxiliary electrode (AE; which is not in contact with the target gas and acts as a reference value).
Values specific to individual Alphasense sensors:
WEe = Electronic zero of working electrode
AEe = Electronic zero of auxiliary electrode
WE0 = Sensor zero of working electrode (working electrode output in purified or ‘zero’ air).
AE0 = Sensor zero of auxiliary electrode (auxiliary electrode output in purified or ‘zero’ air)
Sensitivity = sensitivity of the working electrode measured in mV/ppb
Output values:
WEc = corrected working electrode output
WEu = uncorrected raw working electrode output
AEu = uncorrected raw auxiliary electrode output
Correction values:
NT = temperature-dependent correction value for Algorithm 1 (see Table 1 below)
K’T = temperature-dependent correction value for Algorithm 3 (see Table 1 below)
Alphasense also sent us a useful table which clarified how the values in the list shipped with each sensor correspond to the values used in the algorithms in the application note:
Using the values outlined above, the application note provided to us by Alphasense suggests the following temperature correction algorithms for their NO2 sensor:
Uncorrected WEc = (WEu - WEe) – (AEu - AEe)
Algorithm 1 WEc = (WEu - WEe) – nT(AEu - AEe)
Algorithm 3 WEc = (WEu - WEe) – (WE0 – AE0) – k’T(AEu - AEe)
To get a final gas concentration for each of these algorithms, WEc must then be divided by the Sensitivity value (mV/ppb).
Details of the correction values to be used for each algorithm are also provided in the Alphasense application note (Table 1). In order to calculate the appropriate correction factor, we linearly interpolated the values for each correction factor between the temperature values (Figure 7). In the software we used a handy Arduino library, <InterpolationLib.h>, to achieve this.
Table 1. Correction factors for temperature correction algorithms.
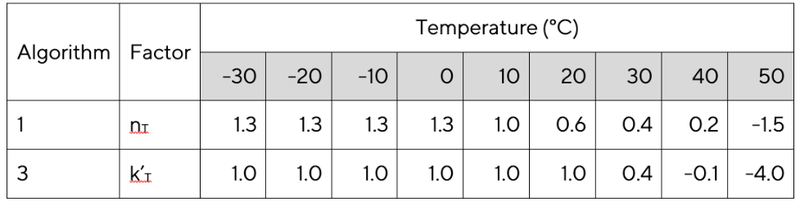
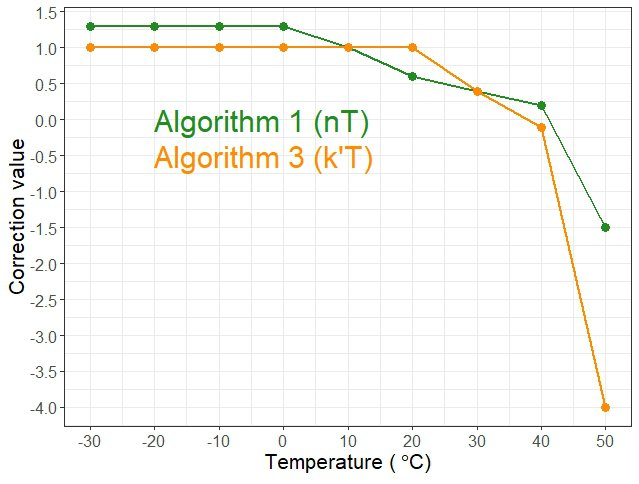
Figure 7. Linear interpolation of correction factor values between temperature values.
Patio testing
I then ran a series of tests on my patio (Figure 8) to (i) test the maximum battery life of the sensor, and (ii) examine how the temperature correction algorithms affected the data. Before running these tests, we made a small tweak to the firmware to adjust the way in which the NO2 data was sampled. Previously, each NO2 reading was based on a single voltage measurement at each specific time point. We changed this so that each NO2 reading is the average across ~1000 voltage readings taken over the course of 1 second, providing more accurate readings that are not dependent on the voltage at a single time point.
The first test revealed that the battery was running for approximately 12 hours (Figure 9). We suspected that this relatively short battery life was because of the pretty much constant use of the PM sensor and the powering of its laser and fan. We made some changes to the firmware to maximise battery life, powering up the PM sensor once per minute and allowing it to read for 10 seconds. This dramatically improved the battery life to between 24 and 36 hours (see results of second patio test in Figure 10).
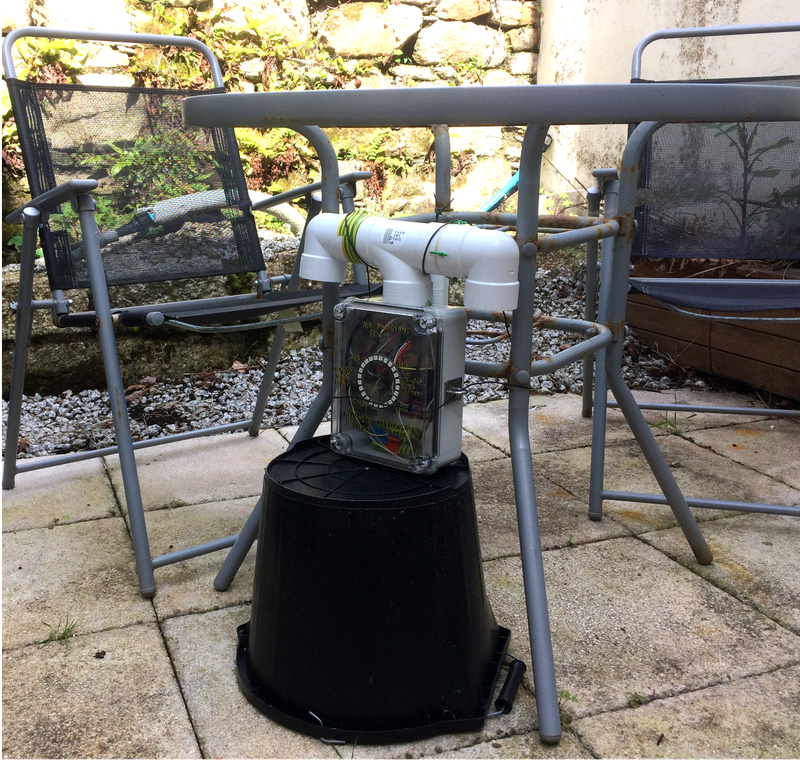
Figure 8. SmogOff patio test setup
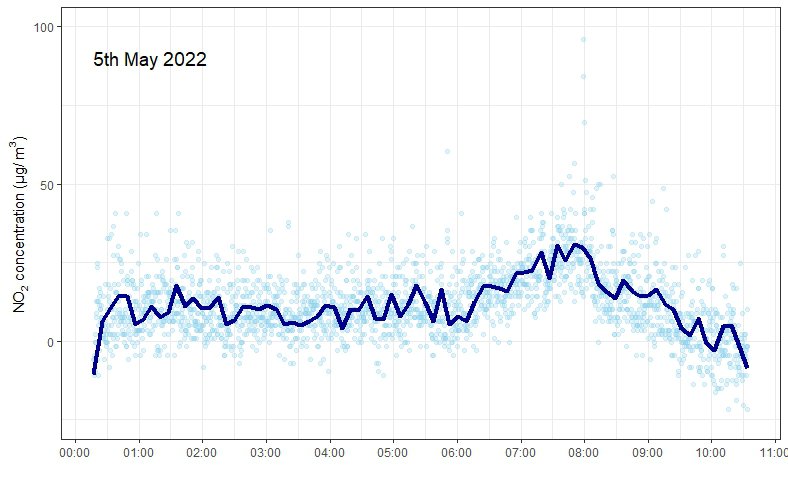
Figure 9. Battery life of sensor from initial patio test. Transparent points are raw data and the line through data points is a smoothed regression line. The first hour of data was removed as the sensors require a warm up period.
I then ran more tests on my patio to compare the different temperature correction algorithms. All three algorithms produced NO2 readings in the range we would expect, but also revealed that the values were often negative (Figure 10). We now plan to co-locate our sensors alongside Cornwall Council’s reference stations to see how well they match, which temperature-correction algorithm gives the best results, and if any additional data processing is required.
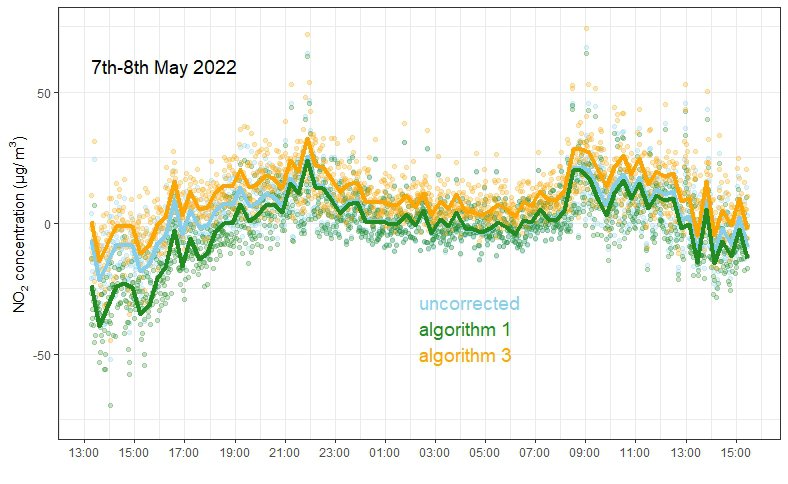
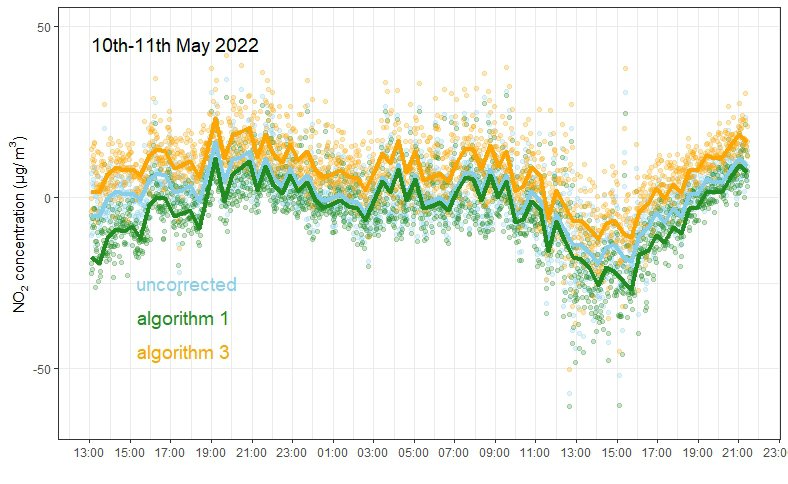
Figure 10. Comparison of temperature correction algorithms for NO2 data. Transparent points are raw data and the line through data points are smoothed regression lines. The first hour of data was removed as the sensors require a warmup period.
However, we were able to co-locate our sensor with a wearable air pollution sensor, the Flow 2 from Plume Labs (Figure 11), which was kindly lent to us by Dr Jo Garrett at the European Centre for Environment & Human Health (ECEHH). These sensors cost around £180 and are really small and easy to use. How exactly they work and which components they use though are a mystery. We were really interested in how the data collected by SmogOff would compare with another low-cost sensor that is commercially available.
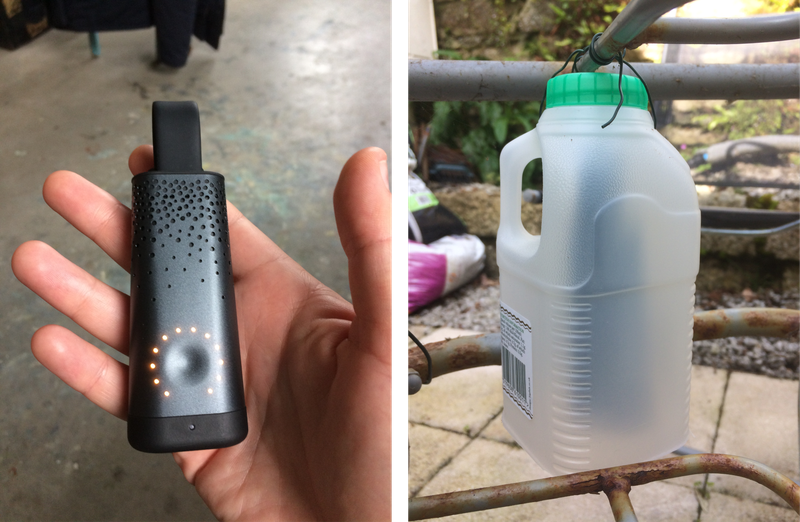
Figure 11. The Flow 2 is a wearable air pollution sensor measuring PM, NO2 and volatile organic compounds (VOCs). The unit isn’t waterproof, so we made a makeshift cover from a milk carton with the bottom removed and placed it within 30cm of the SmogOff sensor.
When we overlay the data collected by the Flow 2 on the data collected by the SmogOff sensor, the two sensors show poor agreement in both NO2 and PM2.5 concentrations (Figures 12 and 13). We anticipate that our future tests against Cornwall Council reference equipment will shed light on which sensor provides more accurate air quality data.
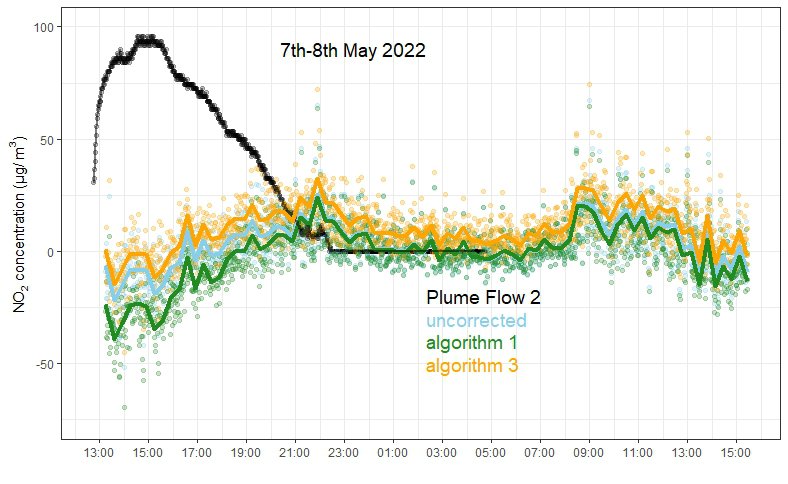
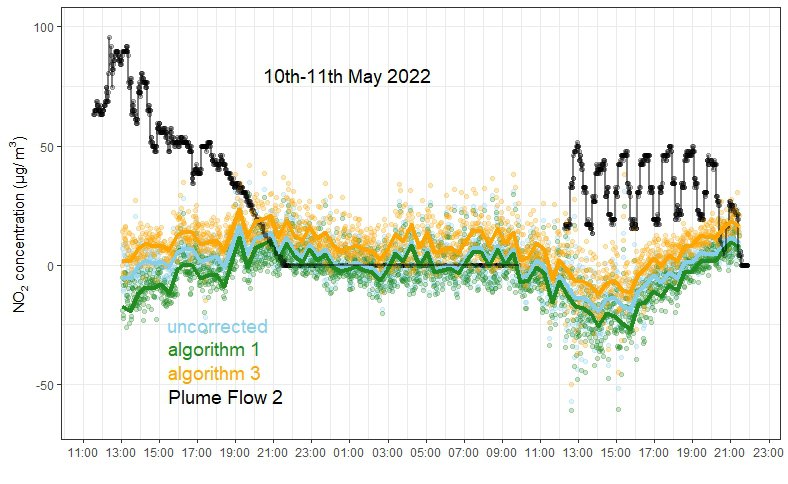
Figure 12. Comparison of NO2 data from SmogOff sensor and Plume Flow 2. Transparent points are raw data and lines through data points are smoothed regression lines. The first hour of data for the SmogOff sensor was removed as the sensor requires a warmup period. The gaps in the Plume data are when the battery ran out, but the battery was still working where the data flat-lines at zero.
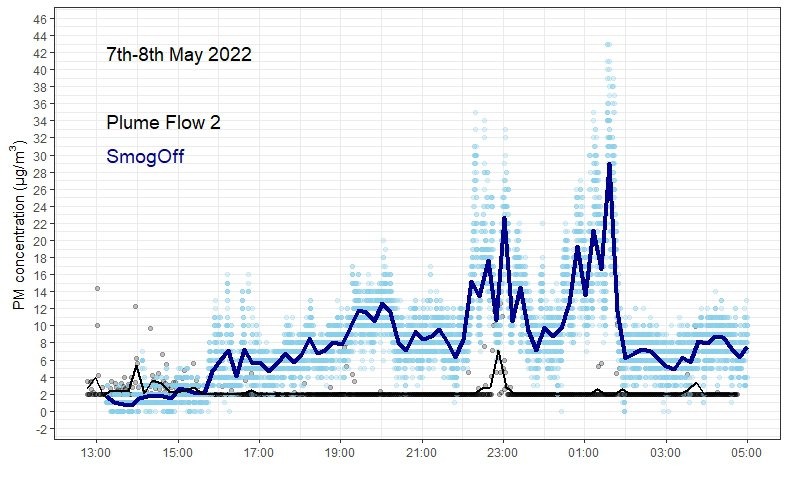
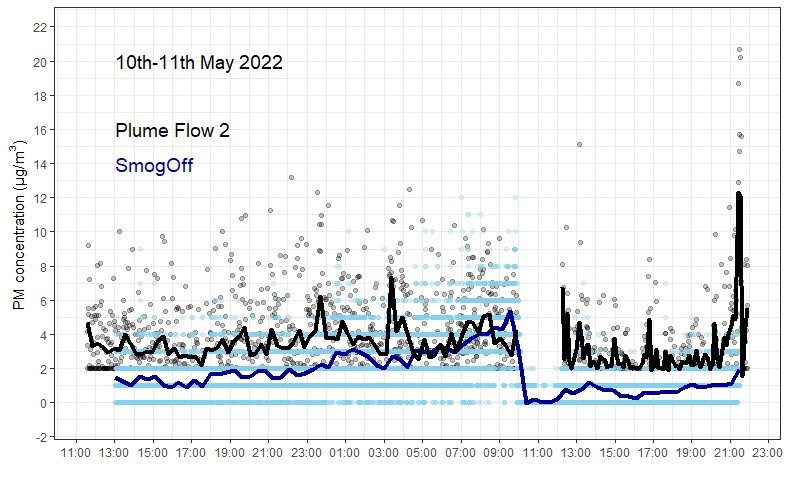
Figure 13. Comparison of PM2.5 data from SmogOff sensor and Plume Flow 2. Transparent points are raw data and lines through data points are smoothed regression lines. The first hour of data for the SmogOff sensor was removed as the sensor requires a warm up period.
Tidying up the circuitry
The wiring of the prototype was getting quite complex, and included a breadboard to make space for all of the components. In subsequent versions of SmogOff, we are planning to house the electronics inside a smaller unit, which will require them to be more compact. I made use of the prototyping area of the Arduino data logger shield and soldered on header sockets, the ADC, pull-up resistor, and most of the connections that were previously connected with jumper leads. This allowed everything to be connected directly to the Arduino and tidied up the cabling.
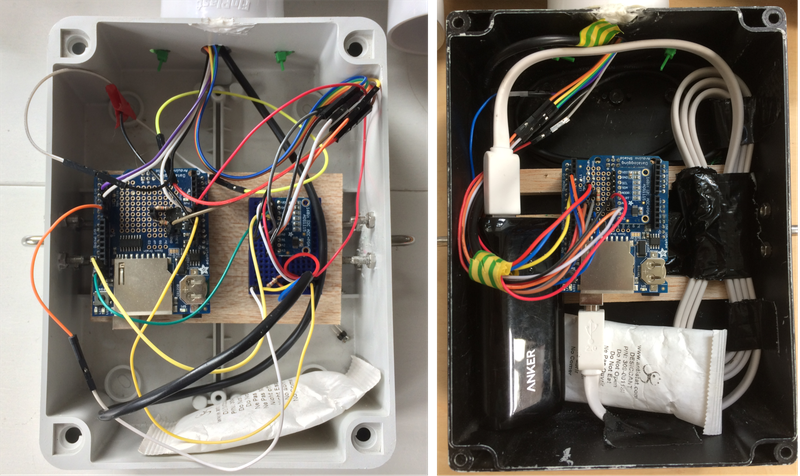
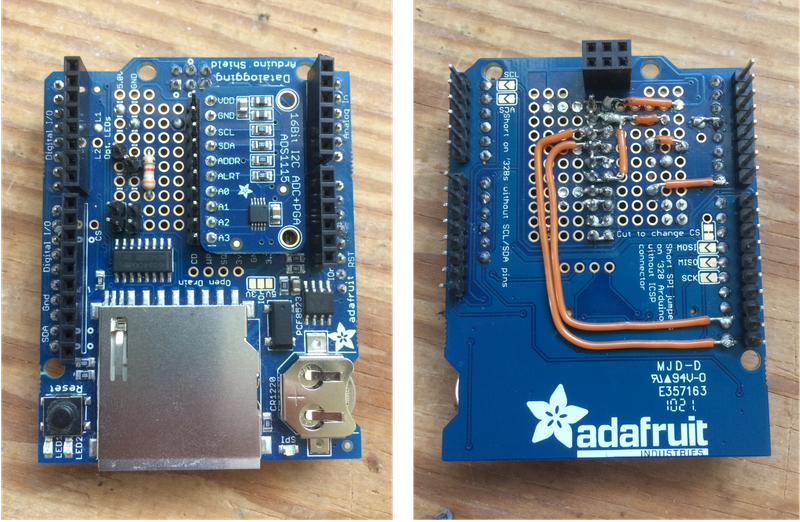
Figure 14. Simplification of SmogOff’s circuitry. Top images show the prototype before (left) and after (right) simplifying the circuit. Bottom images show detail of the components and connections soldered onto the Arduino logger shield to simplify the circuitry.