
This post follows on from our last development notes on the SmogOff air pollution sensor. Having got a SmogOff prototype working and producing readings within the range we might expect, the next step was to check how well the data collected by our SmogOff sensor matched that of high quality reference equipment. We have been working closely with Cornwall Council, who kindly gave us permission to co-locate our sensor alongside their reference station in Truro, allowing us to directly compare the data collected by the two sensors.
There is a network of reference stations (sites that continuously monitor air pollution in specific locations) across the UK. These reference stations contain expensive air quality monitoring equipment that collect reliable, reference-quality data. Co-location exercises are important, as they allow us to evaluate the quality and reliability of the data collected by low-cost sensors.
Co-location setup
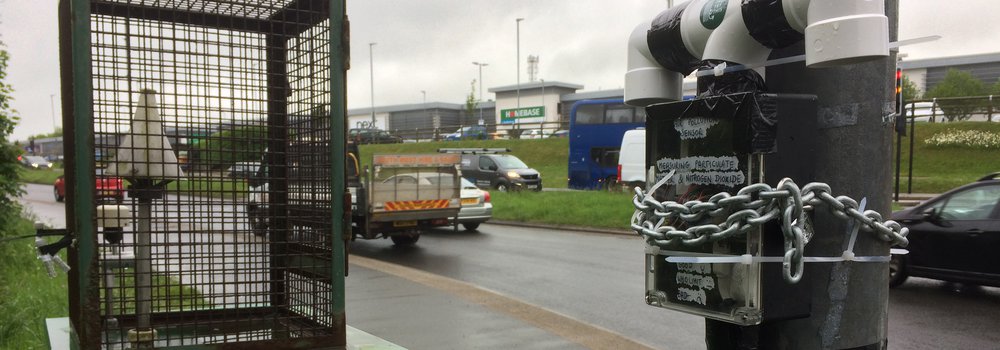
We ran a co-location exercise on 16th and 17th May 2022 against a reference station next to a busy road in Truro. Our SmogOff sensor was attached to a lamppost within approximately one metre of the reference station. The SmogOff sensor was left running for an approximately 36-hour period (from around 09:00 to 20:00 the following day) before being collected.
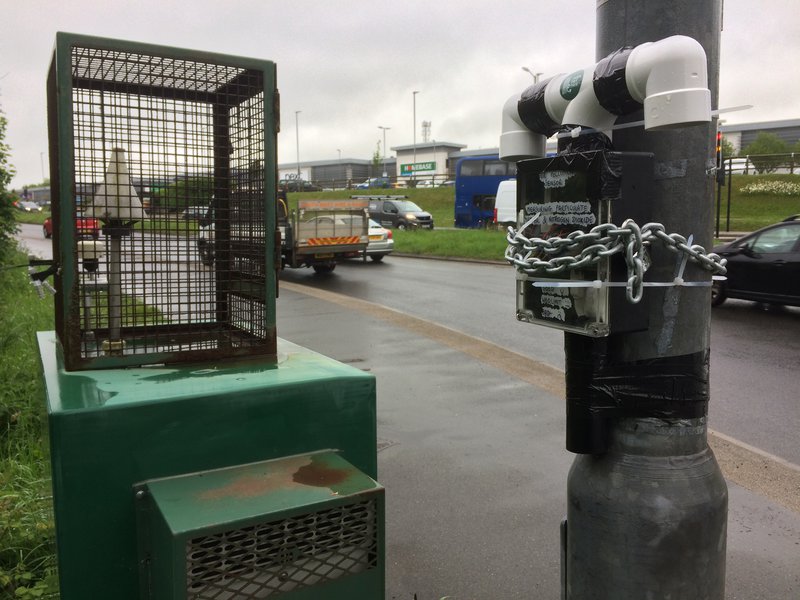
Figure 1. The co-location setup.
Results
Particulate matter
We compared PM10 concentrations collected by SmogOff and the reference station (as the reference equipment does not collect PM2.5 data). When we compare the data collected by the two sensors, they are in good agreement. When we compare the average readings in each 15 minute window, the SmogOff sensor closely tracks changes in PM10 (Figure 2). However, the SmogOff sensor underestimates the absolute values collected by the reference station. Interestingly, comparing the 15 minute maximum readings collected by SmogOff with the 15 minute mean collected by the reference station seems to improve the agreement between the sensors, with the absolute values being more comparable. However, the correlation between the two sensors is weaker when looking at the 15 minute maximum values instead of the mean values (Figure 3).
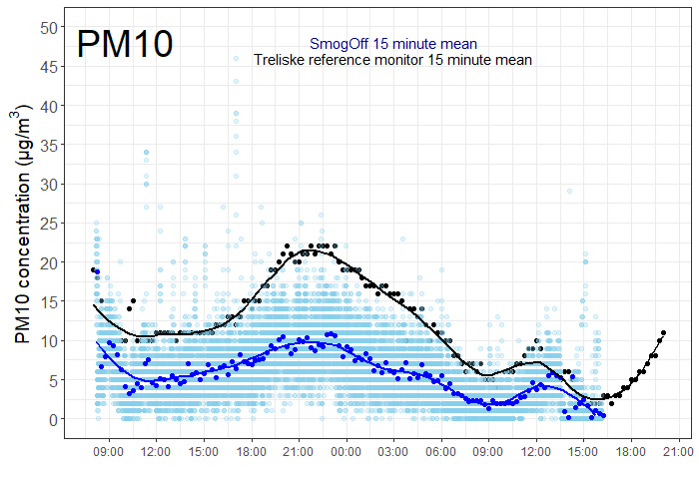
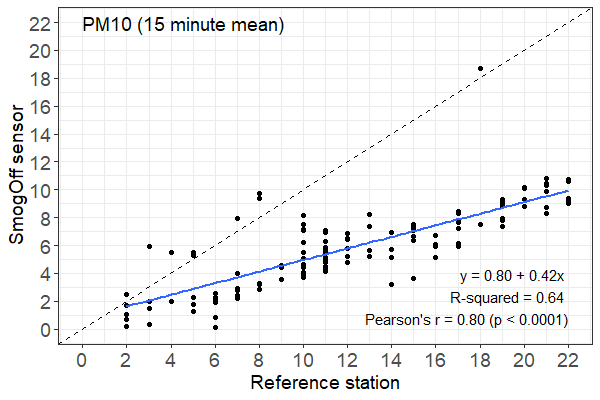
Figure 2. Comparison of PM10 readings (15 minute mean); (top plot) Time-series showing reference station and SmogOff readings during co-location exercise. Transparent blue points are SmogOff raw data. Dark blue and black points are 15 minute mean values for SmogOff and reference station respectively. Lines are smoothed regression lines; (bottom plot) Relationship between the reference station and SmogOff readings. Solid blue line is a linear regression. The equations of the regression line and R2 value are presented, as well as Pearson’s correlation coefficient.
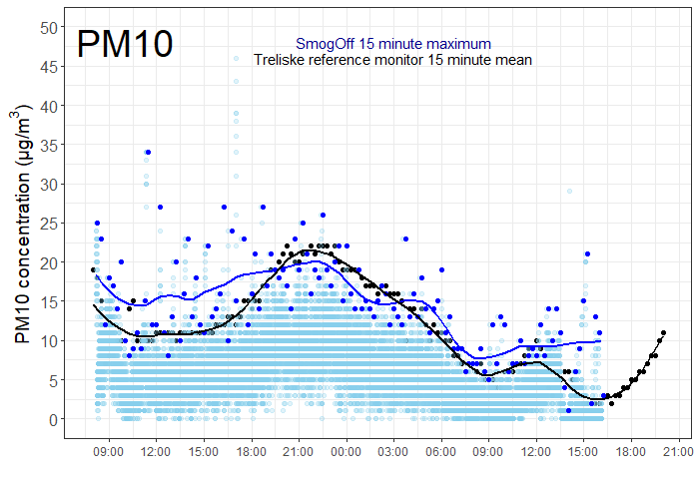
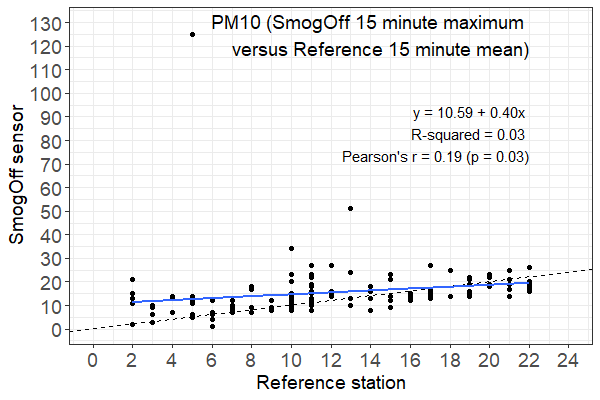
Figure 3. Comparison of PM10 readings (15 minute mean from reference station versus 15 minute maximum from SmogOff sensor); (top plot) Time-series showing reference station and SmogOff readings during co-location exercise. Transparent blue points are SmogOff raw data. Dark blue and black points are 15 minute maximum values for SmogOff and 15 minute mean values for the reference station respectively. Lines are smoothed regression lines; (bottom plot) Relationship between the reference station and SmogOff readings. Solid blue line is a linear regression. The equation of the regression line and R2 value are presented, as well as Pearson’s correlation coefficient.
Nitrogen dioxide
There was lower agreement between the nitrogen dioxide readings collected by our SmogOff sensor and those of the reference station. However, the values were within the range we would expect and broadly seemed to track some of the fluctuations across the duration of co-location exercise. It might be the case that agreement improves when looking over longer timescales (e.g. averaging readings over 3, 6, 8-hour periods), and this is something that we are now planning to explore.
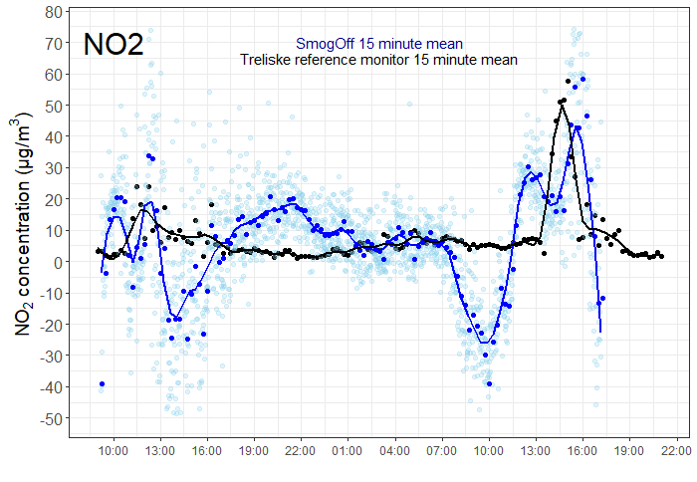
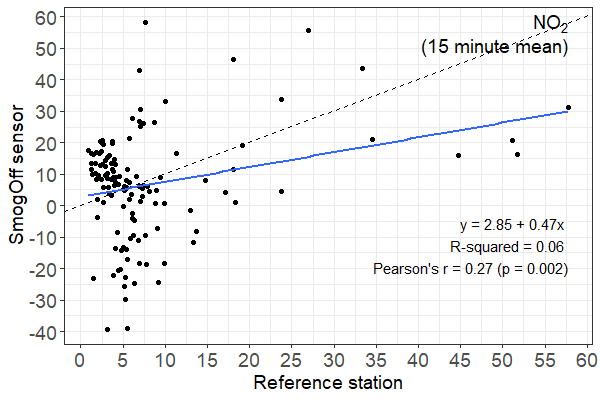
Fig. 4. Comparison of NO2 readings (15 minute mean); (top plot) Time-series showing reference station and SmogOff readings during co-location exercise. Transparent blue points are SmogOff raw data. Dark blue and black points are 15 minute mean values for SmogOff and reference station respectively. Lines are smoothed regression lines; (bottom plot) Relationship between the reference station and SmogOff readings. Solid blue line is a linear regression. The equation of the regression line and R2 value are presented, as well as Pearson’s correlation coefficient.
Next steps
We were unable to access the raw data collected by the reference equipment, as Cornwall Council’s data portal for the reference station only exports data that has been processed (e.g. mean/minimum/maximum values over set time periods). It would be useful to be able to plot the raw data collected by the reference station to see if the variation among SmogOff readings are also apparent in the reference equipment - which would suggest real fluctuations in pollutant levels from minute-to-minute, as opposed to our SmogOff sensor being noisy. The SmogOff sensor also frequently records negative values (which is expected of analogue sensors), and it would be useful to find out whether the raw data from the reference equipment also contains negative values that are not present once the data is processed (e.g. when averaged over a set time period). We are now working with Cornwall Council to see if we can access this information and make further comparisons.
We also now plan to build two more SmogOff sensors and check the agreement among them. This will be an important step to understanding how much the readings vary among individual SmogOff units (e.g. as a result of small differences in their circuitry and components). Once we have an idea of the extent to which there is agreement among our SmogOff sensors, we plan to conduct further co-locations against Cornwall Council’s reference stations and explore ways to improve matching between SmogOff and reference data (e.g. by applying correction algorithms, or exploring whether agreement improves when averaging over longer timescales).