
For the last couple of months, we have been gradually developing our air pollution sensing knowledge. This began with the work of Antony Brown who came to work with us for a while and continued as a Smartline In Residence research project. Initially this project kicked off with a workshop with a environmental consultants, community groups and public health specialists at Cornwall Council and the University of Exeter. All the code and details for this project can be found on our gitlab repository.
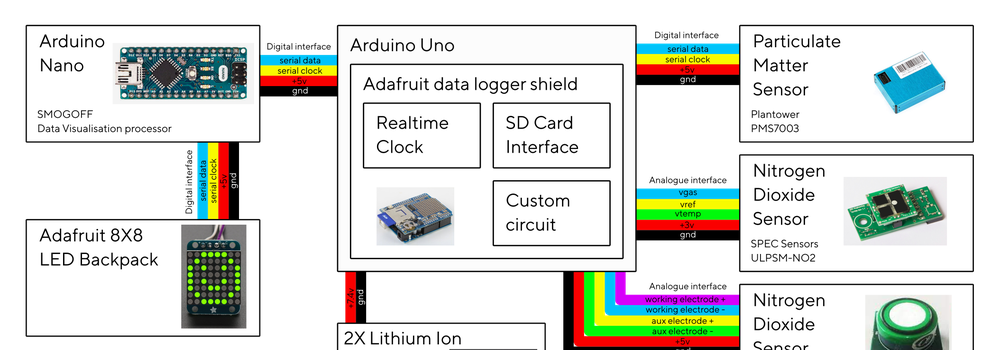
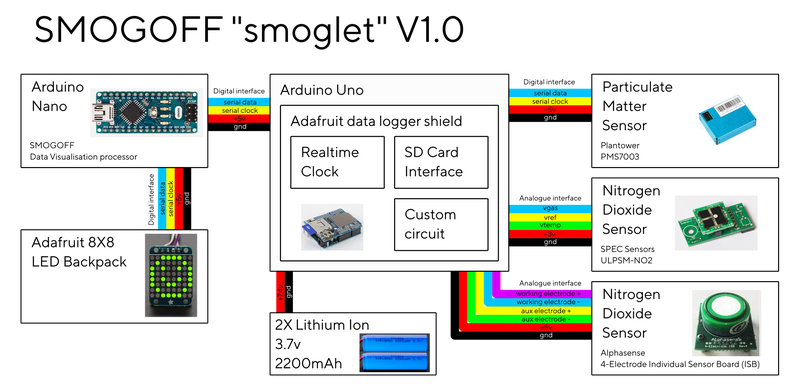
This post contains our development notes for a sensor box to detect air pollution, designed to be left running outside. As described before we settled on using two sensors, particulate matter (as we'd been using before on the sonic kayaks project) and a nitrogen dioxide sensor, to provide a little more specificity alongside the PM sensor. We decided to trial two of these NO2 sensors.
Sensors tend to fall into two categories - digital or analogue. Digital sensors in some respect are very easy to use - the complicated part is deciphering the serial protocol they use for communicating information and interpret the numbers being fed to you. Sensors such as the PMS7003 particulate matter sensor we are using generally contain small processors doing all the calibration and conversion for you - so you can simply read the numbers in the convenient units you'd expect (e.g. micrograms per m3 for air or degrees celsius for temperature) and store them for later use.
Analogue sensors are a very different story. Measurements of specific gasses involves finely tuned electro-chemical processes, the devices vary the current running through by miniscule amounts - nano amps, and are further affected by external changes in voltage, temperature and humidity. These sensors require a lot of circuitry to provide a stable, detectable voltage that can then be read by an analogue to digital converter to provide numbers. Even once you have numbers, they then need processing in software to provide usable units - in the case of nitrogen dioxide, parts per billion or micrograms per m3.
Both the sensors we looked at consist of the sensor itself (the part that varies current) and a separate pre-built circuit that converts the current into voltage. It is also possible to obtain a third module which converts the voltage into digital data for you - but these are too expensive to be practical for a DIY approach. If we wanted to save further costs it is possible to build your own circuits to convert the signal from the sensors - but this is beyond our skills as it requires a deep understanding of analogue circuitry.
SPEC sensors ULPSM N02 Sensor
This is the cheaper of the two NO2 sensors we used. The sensor element can be removed and replaced, as they wear out (become poisoned) with continual use. The sensor specs say it can measure a range from 0-5ppm (0-5000 ppb) concentrations of N02, and the analogue module provides temperature correction, and provides this as one of its analogue outputs. This comes in handy as you can use the temperature to check the sensor is working and you are reading the values properly.
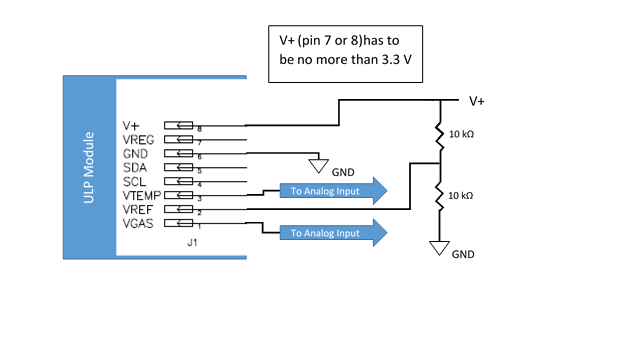
The manufacturers provide a handy github repository with code to read the sensor on an Arduino, which we used for this prototype. There are still a few mysteries to solve even with good example code however. With both of these sensors there is the implication that an Arduino is not really good enough to read the voltages involved, but with the Spec sensor the documentation claims you can alter the circuit to help: "This 2x 10 kOhm voltage ladder increases the current considerably, since the internal voltage ladder is 2x 1MOhm resistors. But for some applications this will also decrease the noise considerably." (we suspect the last line really means to say it may increase the noise considerably).
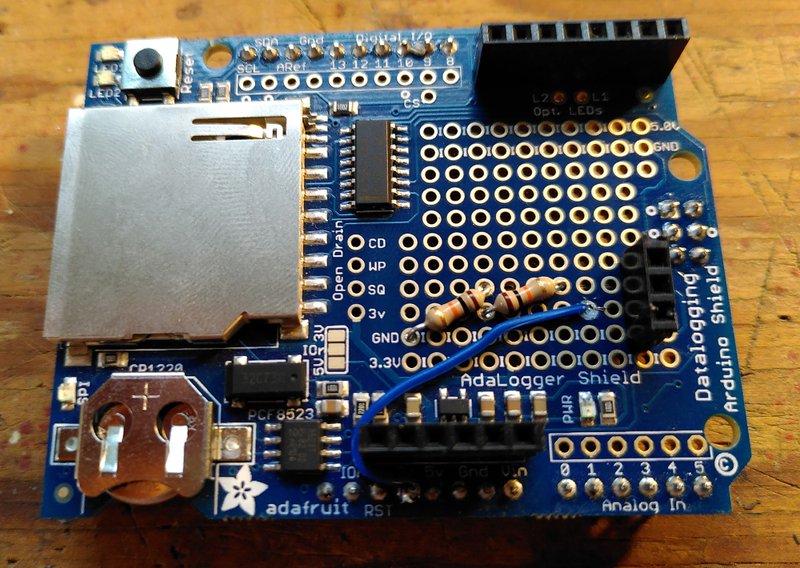
We used the perm-proto section of the Adafruit data logger shield to add this small circuit, these boards often feature areas where you can add your own components and it's always handy as it can be annoying when you have a few small additions like this and needing to make a whole new breakout board to contain them.
With the circuitry set up the next issue is a magic number in the example code - this is a nA/ppm measurement which is taken at the factory for the individual sensor you have bought. There is a tiny QR code on the back of the sensor which can be read by any standard QR code reader app that shows you the alphanumeric data.
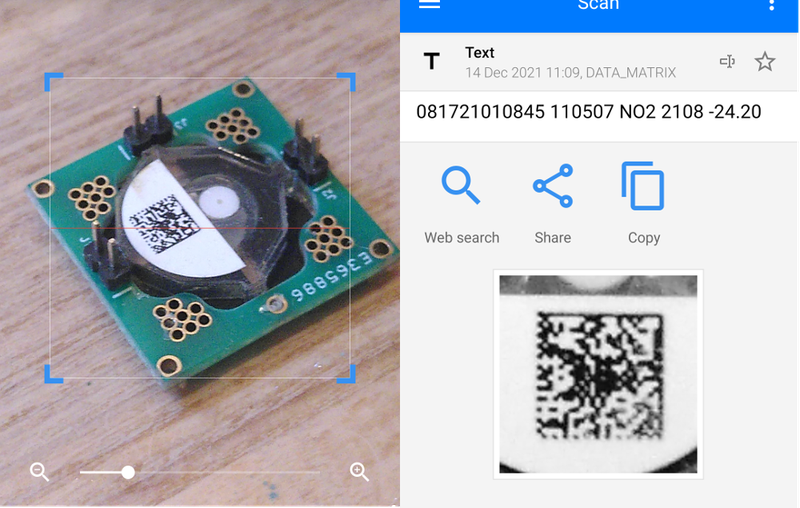
The last number (-24.20) needs to be inserted in the constructor for the NO2 sensor object in the Arduino code along with the analogue pins used for the gas and temperature inputs.
The startup procedure for the sensor is also relatively involved. To begin with we need to sample the voltage at the vgas input when there is no sensor plugged in to the module - this effectively records the average "zero" value which is dependant on the module circuit and how you are powering it. Once that is done, it takes around an hour to settle - this is due to the voltage needing to build up in the sensor element (which can be thought of as a capacitor which needs to come up to charge).
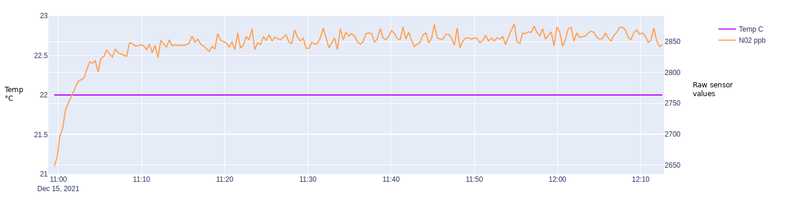
Here we can see this "warm up" period - this was running inside in stable conditions (temperature at 22°C). One of the big problems we found with this sensor is that the value it settles on seems to be fairly random. Whether this is an issue with the reference voltage on the Arduino or something inherent to the sensor we're not sure - but a feature added to the manufacturer's github repository is the ability to "zero" the sensor on user input, although it doesn't specify when this should happen. We program the Arduino to reset to zero after an hour, meaning the startup should go something like this:
- Unplug sensor and start up Arduino
- Wait for the signal that the voltage reference calibration has finished (we flash an onboard LED)
- Plug the sensor in to charge up
- Leave for an hour in clean air environment (ideally at the same temperature you wish to test at)
- Place in area you wish to test
Results
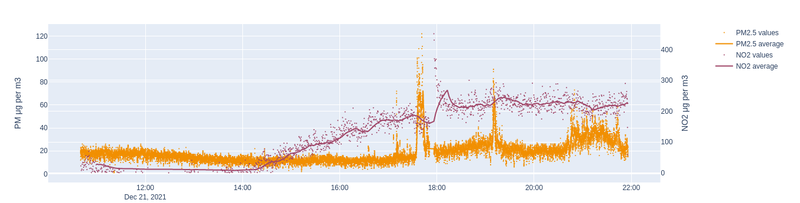
This graph shows raw data from the sensor in purple alongside particulate matter measurements, outside in a Cornish village on a winters day. Spikes in the particulate matter and a general rise in nitrogen dioxide may be coming from wood burners being used in the evening. The scale seems very high for nitrogen dioxide, which may be down to our calibration method - so more testing in needed with this sensor.
Alphasense NO2 sensor
This is a bit more expensive than the SPEC sensors NO2 sensor, and also comes with an analogue voltage converter module (a 4-Electrode Individual Sensor Board, or ISB). This is a very well made, and is probably money well spent - but it has been slightly tricky to get going, with its own idiosyncrasies.
The interface is simple enough, power and 4 other connections - OP1 + and - and OP2 + and -. OP1 is the "Working electrode" (WE) and OP2 is the "Auxiliary electrode" (Aux). WE is the actual value from the sensor and Aux is a reference we can use to eliminate drift in the circuit. Like the first sensor, this one has some values calibrated from the factory - in this case we have three numbers: WE zero, Aux zero and sensitivity.
In terms of what we do with these and what they mean, it took a bit of searching - we found an old PDF manual for the sensor that doesn't seem to be easy to find on their website, with an algorithm in the form of a spreadsheet. This basically boils down to:
((WE_Voltage-WE_Zero) - (Aux_Voltage-Aux_Zero)) / sensitivity = offset drift compensated ppm
The constant WE/Aux zero levels are subtracted to bring the two voltages (more specifically the voltage difference between + and -) down to their correct values, and then we calculate the difference between WE and Aux. This result is then further tweaked to account for sensitivity (which is a factor of the sensor, not the module itself).
After all this - the good news is that there is no further calibration required, unlike the SPEC sensors one. There is no temperature output on this sensor, so we cannot log that.
Results
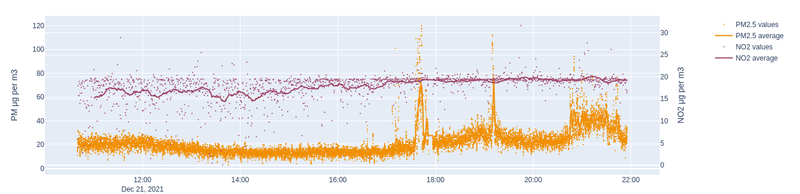
This shows the data from the sensor at the same day and location as the test above with the SPEC sensor, but with a different particulate matter sensor. The nitrogen measurements also show a similar rise in the later part of the day, but with this sensor the values are far more realistic for the situation. Looking at the way the data transitions between values, it would seem the Arduino is capable of reading it sufficiently, but only just. It would be better to use either a dedicated ADC chip, or boost the voltage with a dedicated opamp circuit - this would give better accuracy at low level readings.
Putting it all together
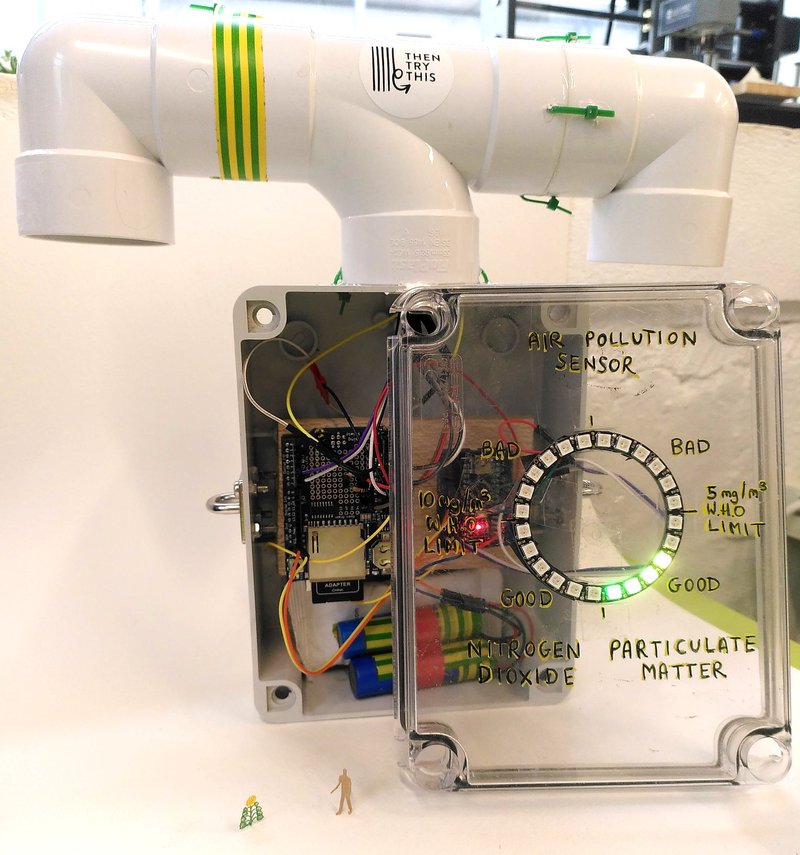
The electronics are housed inside waterproof boxes with clear fronts, with plumbing pipe attached to the top to allow air to reach the sensors while stopping rain getting in as much as possible. This is only a prototype, bespoke housing could be made in future, and it could also be miniaturised.
Realtime visualisation
For the prototyping stage we tried two different LED displays. Firstly an Adafruit Neopixel ring with 24 LEDs, using one side of the ring (12 LEDs) to show PM2.5 levels and the other side of the ring to show NO2 levels.
Secondly a mini Adafruit 8x8 matrix in ultra bright white, where PM2.5 and NO2 levels were combined to have a single good-medium-bad air quality reading, and a smiley-flat-unhappy face as a very simple display.
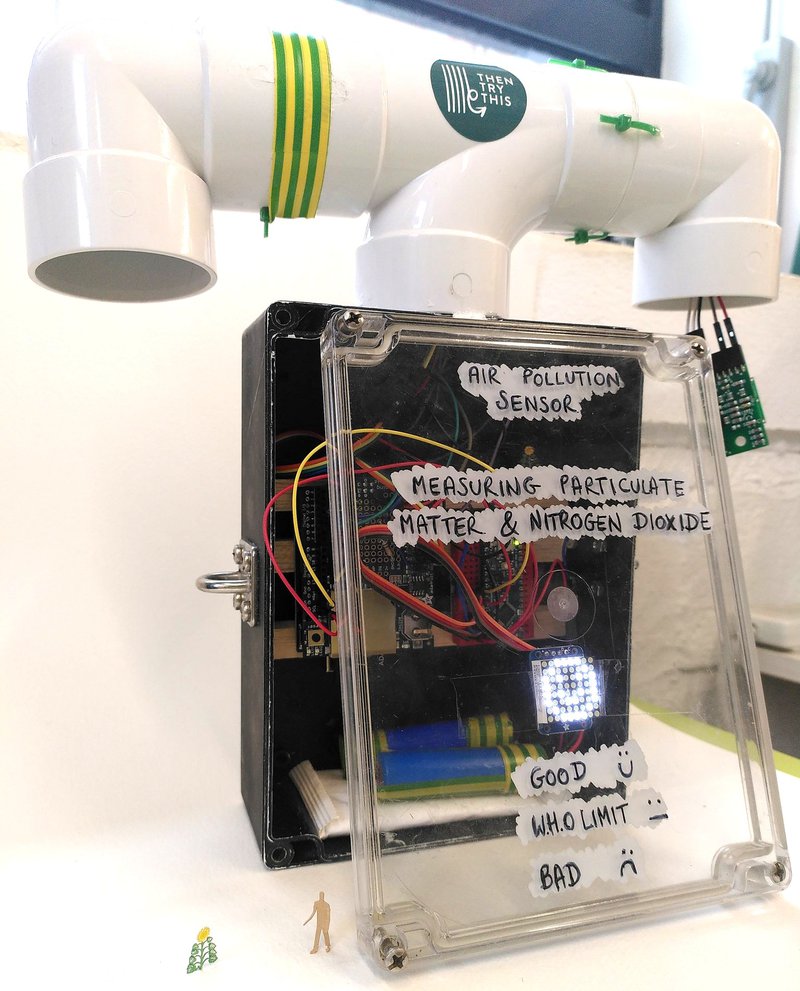
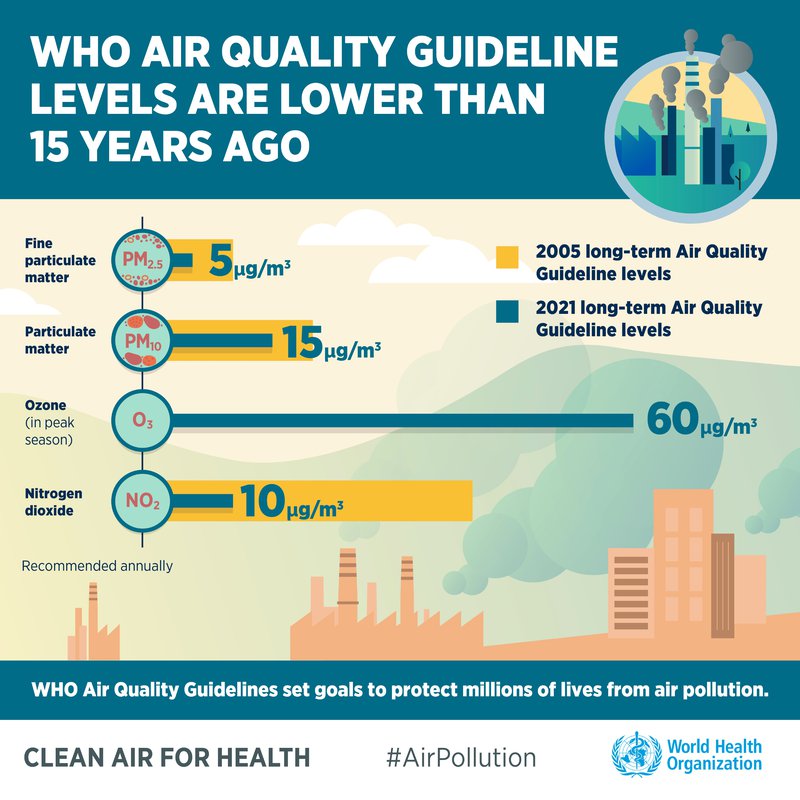
For each type of display we used the new World Health Organisation guideline levels for thresholding.
Implementation
While the particular matter sensor is very fast to give accurate readings, the NO2 sensor takes a long time to acclimatise and can not generate such fast readings. This rules out having an NO2 sensor on a moving object like we've done before with particulate sensors on kayaks/bikes. We've focused on making something for static use that can be attached to lamp posts or railings along roads for example. After lots of meeting with Cornwall Council, it seems we can co-locate our sensors with the council's much more expensive and accurate ones (located 3 x Truro, 1 x Bodmin, 1 x Camborne 1 x Tideford) to calibrate them - though this will have to wait for another phase of the project.
Meetings with the council, building owners, and cycling organisations indicated lots of local situations where people want data on air pollution on a finer scale and more real-time than is available from the council's continuous monitors or DEFRA for example:
- Monitoring pollution levels in a children's play area directly alongside a busy road in Penryn, and seeing if mitigation attempts make any difference.
- Monitoring air pollution before and after cycle lane trials are implemented (although it appears funding has been cut for these cycle lanes, so they may not be happening).
- Displaying air pollution outside schools to try to encourage people to walk/cycle rather than dropping kids off in fossil fuelled vehicles.
- Displaying air pollution alongside traffic lights and outside buildings to try to stop people idling their engines.
We talked with Dr. Tamaryn Menneer, Smartline Research Fellow who told us about a project Smartline had rolled out to 300 Coastline Housing homes in Cornwall to monitor the indoor environment by recording data such as temperature, air quality and humidity. The residents were provided with tablets with a "dashboard" user interface to view the data, but after only 63 householders used them they did detailed research into the reasons why and how best to present and describe the data to be more meaningful. This kind of work based in real case studies is exactly what is needed in this area, as often so much effort goes into collecting data without enough thought on what happens next.
We also had a really interesting meeting with Lewis Elliott from the European Centre for Environment and Human Health on persuasive health messaging. This is something we'll need to think about more at a later stage of the project, but essentially it seems that whatever messaging approach you take, it will work for some people and make things worse for other people, so the choice of who you're messaging is critical. Lewis talked us through some different approaches, like providing direct instruction 'you are causing pollution', normative information 'other people turn their engines off', outcome based information 'idling your engine results in air pollution', or messaging around self-efficacy to build confidence in achievable behaviour changes 'air pollution can be reduced easily, choose to cycle instead of drive'. Direct instruction and outcome expectancy messaging approaches apparently don't work very well unless the person is already motivated, while normative and self-efficacy messaging approaches can put off more motivated people. There's lots of evidence now that individualised messaging works well, and that we rely heavily on mental shortcuts (that are often irrational), like using a trusted source or thinking about our last experience with something. In general it seems that the key is to persuade someone to make a plan to change behaviour, in view of a potential barrier, in order to change their confidence levels so they know they can successfully make a change.
References
Part of Smartline's funding model includes time from academics to support the project - we received this helpful list of references to do with air pollution and health from Richard Sharpe (European Centre for Environment and Human Health and Advanced Public Health Specialist at Cornwall Council):
Community Air Sensor Network (CAIRSENSE) project: evaluation of low-cost sensor performance in a suburban environment in the southeastern United States (2020). https://www.ncbi.nlm.nih.gov/pmc/articles/PMC7425750/ OA
Applications of low-cost sensing technologies for air quality monitoring and exposure assessment: How far have they gone? (2018). https://www.ncbi.nlm.nih.gov/pmc/articles/PMC6145068/ OA
Wireless Distributed Environmental Sensor Networks for Air Pollution Measurement—The Promise and the Current Reality (2017) https://www.ncbi.nlm.nih.gov/pmc/articles/PMC5677343/ OA
From a Low-Cost Air Quality Sensor Network to Decision Support Services: Steps towards Data Calibration and Service Development (2021) https://www.ncbi.nlm.nih.gov/pmc/articles/PMC8124547/ OA
C-C1-02: Creating a GIS Infrastructure to Evaluate Air Quality’s Effect on Health Outcomes (2010) https://www.ncbi.nlm.nih.gov/pmc/articles/PMC3006533/ OA
Long-term field comparison of multiple low-cost particulate matter sensors in an outdoor urban environment (2019) https://www.ncbi.nlm.nih.gov/pmc/articles/PMC6522472/ OA
Personal Exposure Estimates via Portable and Wireless Sensing and Reporting of Particulate Pollution (2020) https://www.ncbi.nlm.nih.gov/pmc/articles/PMC7037995/ OA
Examining spatiotemporal variability of urban particulate matter and application of high-time resolution data from a network of low-cost air pollution sensors (2021) https://www.ncbi.nlm.nih.gov/pmc/articles/PMC8193829/ OA
A Wearable Low-Power Sensing Platform for Environmental and Health Monitoring: The Convergence Project (2021) https://www.ncbi.nlm.nih.gov/pmc/articles/PMC7961452/ OA
Impact of Air Pollution on Asthma Outcomes (2020) https://www.ncbi.nlm.nih.gov/pmc/articles/PMC7503605/ OA
The Global Contribution of Outdoor Air Pollution to the Incidence, Prevalence, Mortality and Hospital Admission for Chronic Obstructive Pulmonary Disease: A Systematic Review and Meta-Analysis (2014) https://www.ncbi.nlm.nih.gov/pmc/articles/PMC4245645/ OA
External Environmental Pollution as a Risk Factor for Asthma (2021) https://www.ncbi.nlm.nih.gov/pmc/articles/PMC7801569/ OA
Long-term exposure to NO2 and O3 and all-cause and respiratory mortality: A systematic review and meta-analysis (2020) https://www.ncbi.nlm.nih.gov/pmc/articles/PMC7549128/ OA
Effect of outdoor air pollution on asthma exacerbations in children and adults: Systematic review and multilevel meta-analysis (2017) https://www.ncbi.nlm.nih.gov/pmc/articles/PMC5358780/ OA
Exposure to outdoor air pollution and its human health outcomes: A scoping review (2019) https://www.ncbi.nlm.nih.gov/pmc/articles/PMC6522200/ OA
Association between Ambient Air Pollution and Diabetes Mellitus in Europe and North America: Systematic Review and Meta-Analysis (2015) https://www.ncbi.nlm.nih.gov/pmc/articles/PMC4421762/ OA
Exposure to outdoor air pollution and its human-related health outcomes: an evidence gap map (2019) https://www.ncbi.nlm.nih.gov/pmc/articles/PMC6924861/ OA
The Effects of Air Pollution on the Development of Atopic Disease (2021) https://www.ncbi.nlm.nih.gov/pmc/articles/PMC8215519/ OA
Positive association between outdoor air pollution and the incidence and severity of COVID-19. A review of the recent scientific evidences (2021) https://www.ncbi.nlm.nih.gov/pmc/articles/PMC8378989/ OA
The effects of outdoor air pollution on the respiratory health of Canadian children: A systematic review of epidemiological studies (2015) https://www.ncbi.nlm.nih.gov/pmc/articles/PMC4596651/ OA
Outdoor Particulate Matter Exposure and Lung Cancer: A Systematic Review and Meta-Analysis (2014) https://www.ncbi.nlm.nih.gov/pmc/articles/PMC4154221/ OA
Epidemiological time series studies of PM2.5 and daily mortality and hospital admissions: a systematic review and meta-analysis (2014) https://www.ncbi.nlm.nih.gov/pmc/articles/PMC4078677/ OA