
The concept for the viruscraft game is to have a realtime genetic model or simulation of the host evolution which is adapting to the properties of a virus you are building (either on screen or via a tangible interface as part of an exhibit). This model needs to be realistic, but only up to a point - it can be more of a caricature of biology than a research model would need to be, as our intentions are educational rather than biological research.
Using our previous species prototype as a starting point, we have a network of connected locations that can be inhabited by organisms. These organisms can jump to neighbouring locations and be infected by others in the same place at the same time. Now we need to figure out how different species of these organisms could emerge over time that evolve immunity to a virus - so we can build up a family tree (phylogeny) similar to the ones we created for the egglab game but that is responding to the viruses that you create in realtime as you play. The evolution itself also has to happen fast enough that you can see effects of your actions 'quickly enough', but we'll worry more about that later.
For a job like this we need to move back from fancy visualisations and graphics and try to get some fundamental aspects working, using standard tools like graphviz to understand what is going on to save time.
The first thing to do is to add a fixed length genetic string to each individual organism, this is currently 40 elements long and is made from biologically based A,T,C and G nucleotide symbols. We chose these so we can use biological analysis tools to test the system as we go along just like any other genetic process (more on that below). The organisms can also reproduce by spawning copies of themselves. When they do this they introduce random errors in the genetic code of their offspring which represents mutation.
Previously we were using a 'SIRS' model for virus infection (susceptible -> infected -> recovered -> susceptible), based on 4 global parameters that determined the probability of jumping from one state to the next. Using the genetics, the probability of infection is now different for every individual based on:
1. Is a virus infected individual in the current location?
2. If so, use our genetic code to determine the probability of catching it. Currently we use the ratio of A's to T's in the genetic string as a totally arbitrary place-holder 'fitness function', the lower the number the better. AAAAAAT is bad (fitness: 6) while TTTTTTA is good (fitness: 0.1666) - so we would expect the A's to disappear over time and the T's increase in the genetic strings. This number also determines the probability of dying from the disease and (inversely) the probability of gaining immunity to it.
3. A very small 'background infection' probability which overrides this, so the virus is always present at a low level and can't die out.
The next thing we need is a life cycle for the organism - this needs to include the possibility of death and the disease model is now a 'SIR' one, as once recovered, individuals cannot go back to being susceptible again.
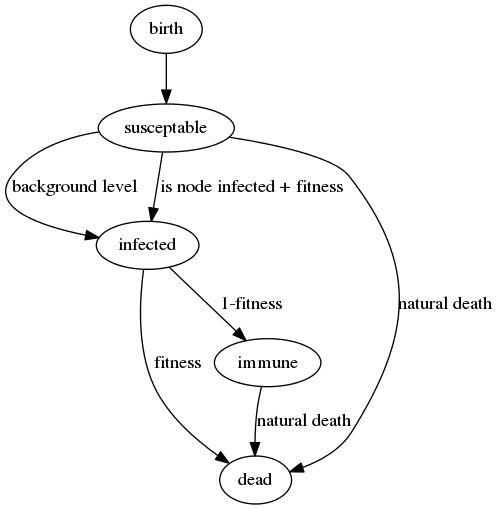
All the other non virus related probabilities in the simulation (spawning offspring, moving location, natural death) are currently globally set - to make sure we are seeing evolution based only on disease related behaviour for now.
This model as it is could form the foundation of a world level visualisation - seeing organisms running around from place to place catching and spreading your virus and evolving resistance to it. However this is only half the story we want to tell in the game, as it doesn't include our time based 'phylogenetic' family tree view. For this, we still need to figure out how to group individuals into species so we can fully visualise the effects of your virus on the evolution of all the populations as a whole.
First we need to decide exactly what a species is - which turns out to be quite an arbitrary concept. The rather course approach that seems to work here is to say that two organisms represent two distinct species if more than a quarter of their genes are different between them. We can now check each organism as it's born - and compare its genome against a 'blueprint' one that represents the species that it's parent belongs to. If it's similar enough we add it to its parents species, if it's too different we create a new species for it. This new species will have a copy of its genome as the 'blueprint' to compare all its descendants with. This should mean we can build up a set of related species over time.
If we run the simulation for 5000 time steps we can generate a phylogenetic family tree at the end, using the branch points between species to connect them. We are hiding species with only 1 member to make it simpler, and the population is started off with 12 unique individuals. Only one of which (species 10) is successful - all the later species are descendants of that one:
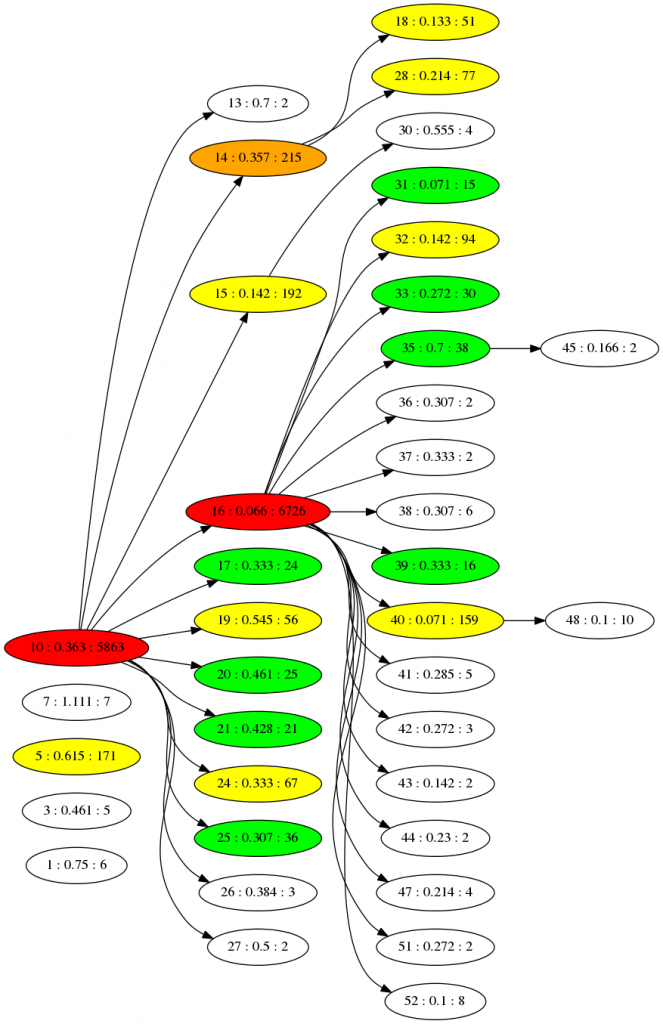
The numbers here are the ID, fitness and size of population for each species. The colours are an indication of population size. The fitness seems to increase towards the right (as the number drops) - which is what we'd expect if new species are emerging that cope better with the virus. You can imagine changing the virus will cause all this to shift dramatically. The "game mechanic" for viruscraft will all be about tinkering with the virus in different ways that changes the underlying fitness function of the host, and thus the evolution of the populations.
As we used standard biological symbols for our genetic code, we can also convert each species into an entry in a FASTA format text file. These are used by researchers to determine population structure from limited information contained in genetic samples:
> 1 0.75 6 TGCTCTTGCGTACTAGACTGTTGACATCTCCACCGGATAA > 3 0.46153846153846156 5 TGGTTTTCTGCTGTGGGGATAACCTGCCACTCAGTGGTGA > 5 0.6153846153846154 171 CACTATCGCTCATTGCACTGTCGTGGTTTTAGTAACGAGC ...
In the FASTA file in the example above, the numbers after the '>' are just used as identifiers and are the same as the tree above. The second line is the blueprint genome for the species (its first individual). We can now visualise these with one of many online tools for biological analysis:
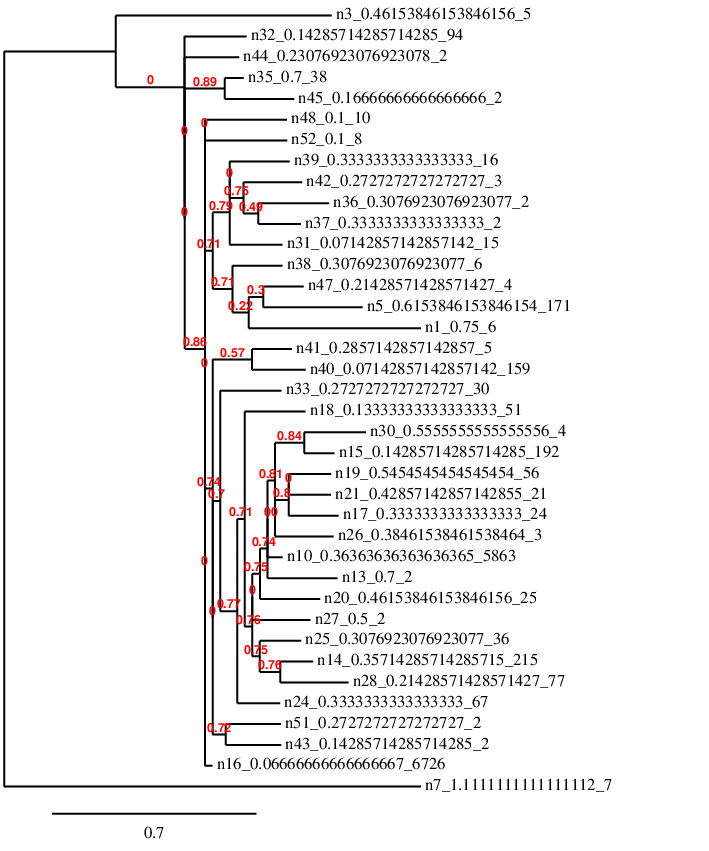
This analysis is attempting to rebuild the first tree in a way, but it doesn't have as much information to go on as it's only looking at similarity of the genetic code. Also 40 bases is not really enough to do this accurately with such a high mutation rate - but I think it's a good practice to keep information in such a way that it can be analysed like this.