We use all sorts of approaches for making complex information easier to access and understand. Over the last year or so, I've been on a part time MA on Authorial Illustration, which adds a new string to this bow, and I've been learning more about how illustration and print approaches can add depth to storytelling.
As part of the course, we had to write an essay (which is never my favourite thing to do). I used this as an opportunity to do a bit of a retrospective and try to figure out how everything fits together, from my academic career in science, through over a decade setting up and running Then Try This, to this new direction in illustration.
I look in turn at different modes of illustrating complexity, from graphs and data visualisation (the go-to during my academic career), to data illustration and explorable explanations (approaches we use routinely at Then Try This), and finally to graphic novels (representing the MA course). I was unsure about publishing this on the TTT site, but hopefully it can have more of a life this way and be useful to someone out there! You can read the essay here.
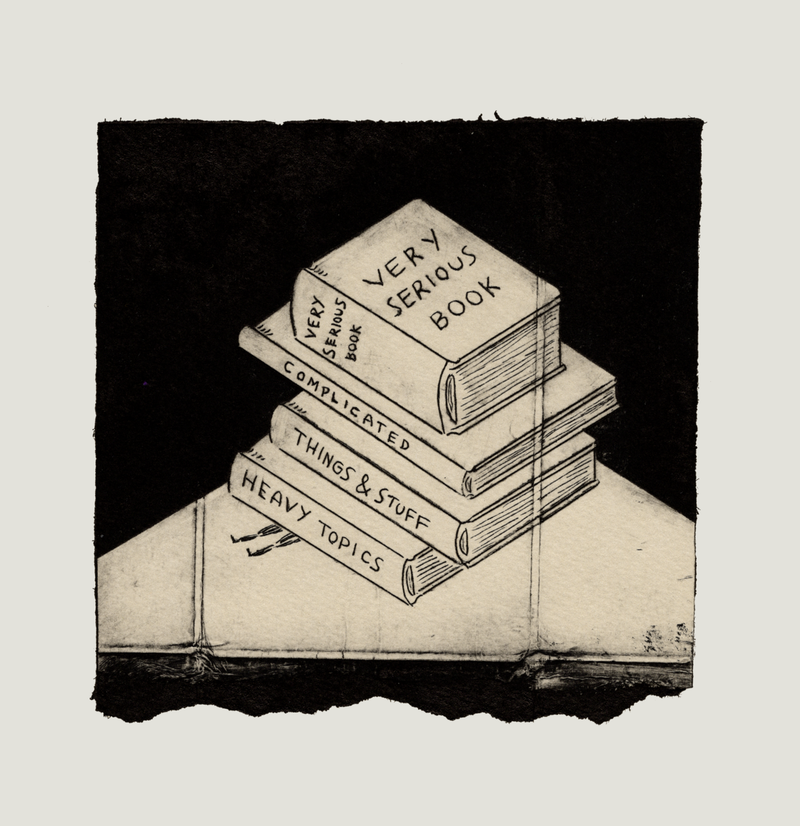
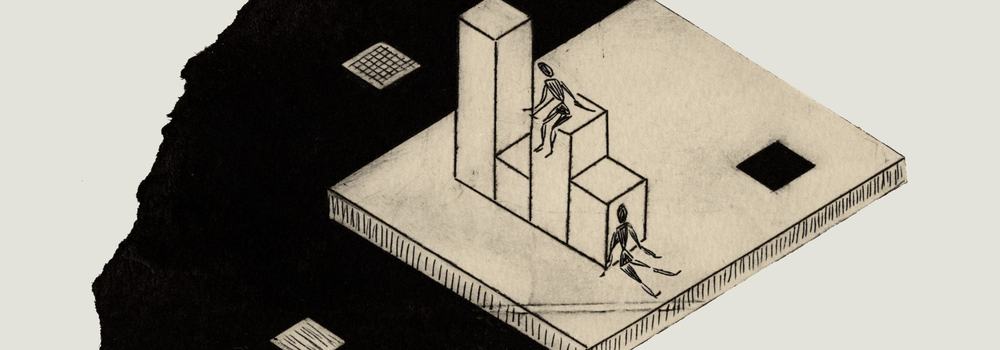
As part of the process, I made a series of seven prints which are dotted through the essay. This was my first try with tetrapak printing - where old oat milk cartons are scratched, cut and torn, inked up and run through a big old cast iron press with damp paper to yield surprisingly rich textural results. I also modified a dusty old pasta machine into a tiny press in the studio which works pretty well, and makes for a nice low-tech low-cost approach to printing (though it doesn't achieve the lovely deep consistent black over large areas).