Some examples of graphs that scientists have created and published using Hapstar, all these images were taken from the papers that cite the hapstar publication, with links to them below. I think the range of representations of this genetic information indicate some exciting new directions we can take the software in. There are also some possibilities regarding the minimum spanning tree, finding ways to visualise and explore the range of possible MST's for a given graph.
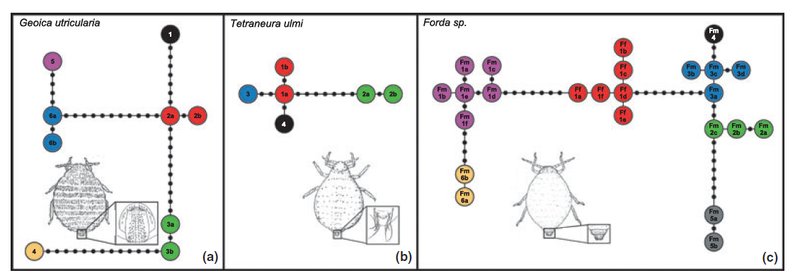
IVENS, ABF, et al. "Reproduction and dispersal in an ant‐associated root aphid community." Molecular Ecology (2012).
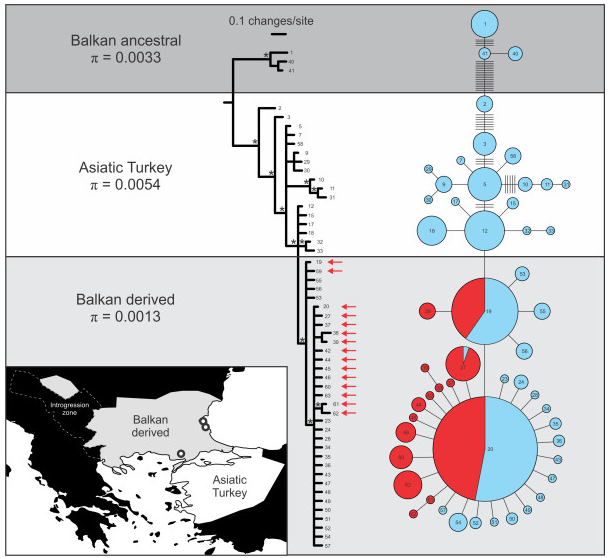
Wielstra, Ben, and Jan Arntzen. "Postglacial species displacement in Triturus newts deduced from asymmetrically introgressed mitochondrial DNA and ecological niche models." BMC Evolutionary Biology 12.1 (2012): 161.
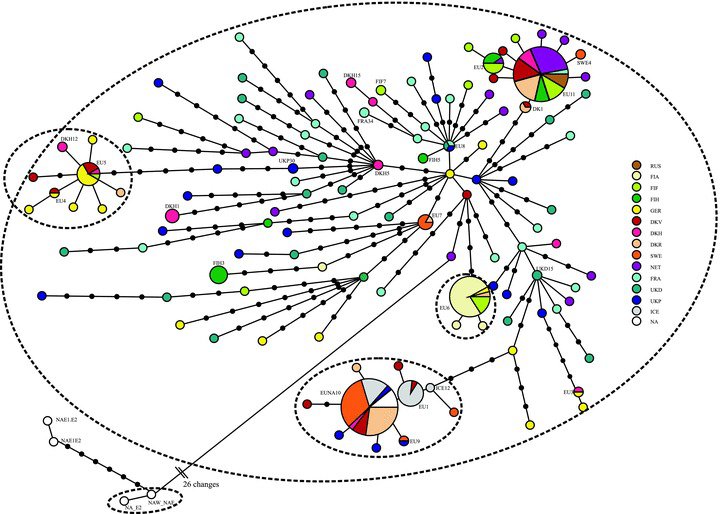
Kesäniemi, J. E., Rawson, P. D., Lindsay, S. M. and Knott, K. E. (2012), Phylogenetic analysis of cryptic speciation in the polychaete Pygospio elegans. Ecology and Evolution, 2: 994–1007. doi: 10.1002/ece3.226
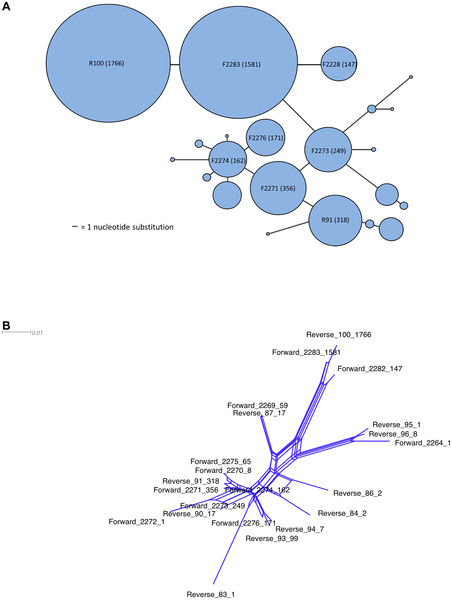
Vos M, Quince C, Pijl AS, de Hollander M, Kowalchuk GA (2012) A Comparison of rpoB and 16S rRNA as Markers in Pyrosequencing Studies of Bacterial Diversity. PLoS ONE 7(2): e30600. doi:10.1371/journal.pone.0030600