At Then Try This, we are thinking about creative ways to publicly display/sonify data collected by the air pollution sensor we are developing. The data collected by our sensors will provide an opportunity to communicate and engage with the local community on the issue of air quality. We have been looking for inspiration from other projects, and have put together this short blog post to showcase some inventive ways to visualise/sonify data.
Visualisation
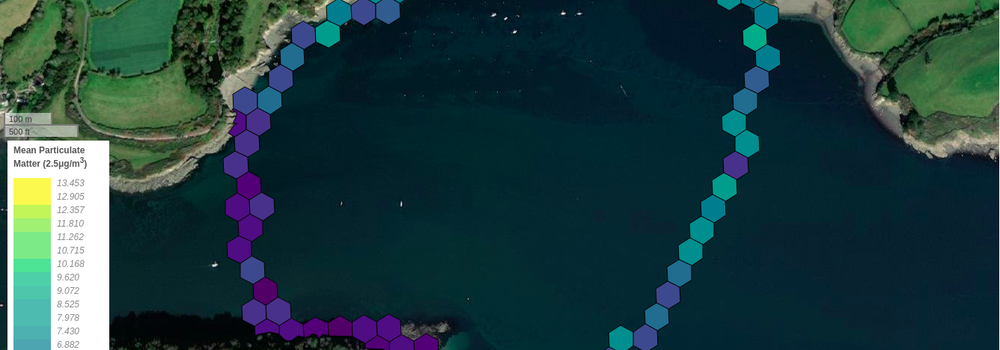
Maps are perhaps the most obvious and intuitive way to visualise how air pollution levels vary across space. As long as each data point collected by an air pollution sensor is associated with location data (e.g. a GPS point), maps can be overlaid with these data (e.g. from bike rides through a city, or a Sonic Kayak journey [see figure 9 from our paper]). 3D maps can make the variation and spikes in pollution levels really clear and easy to interpret.
I found some really interesting projects that use augmented reality (AR) technology, where a virtual world is superimposed over a view of the real world, to visualise air quality data. These projects allowed users to “see” pollution by creating digital objects (where invisible particles were represented in a scaled-up digital form) that were combined with views of the real world. They use the size or density of these digital particles to represent pollution concentrations, which works really nicely to visualise air quality:
- The New York Times created an AR app that allowed users to visualise the air quality of various cities across the world using their mobile phone.
- London-based Studio Above&Below designed an AR sculpture called Digital Atmosphere that comprises a wearable pollution sensor and AR headset. The user sees a “flock” of digital particles overlaid on the real world, and the dynamics of the flock reflect actual air pollution levels.
- The AirBare project is a public installation that combines live images from a street-view camera with AR visualisation of air pollution (virtual particles reflecting real-time air pollution levels). The combined real-world and virtual-world images are displayed on a large touchscreen monitor, which allows the public to interact with the installation and learn more about air pollution.
Other public art installations communicate air quality data in slightly more abstract ways. For example, Particle Falls was a large-scale virtual waterfall projected onto the side of a building that shifted and changed in real-time in response to air quality data collected by a PM sensor at street level. Another example is the Yellow Dust installation, which creates a cloud of water vapour to represent real-time PM data.
Another project that caught my eye was the “light painting” photographs taken as part of the Air of the Anthropocene project. The artists used a custom Raspberry Pi-controlled device comprising a PM sensor attached to an LED light stick to create long-exposure images that visualise air pollution levels in various locations.
Sonification
Data can also be communicated through sound as well as visuals. Our Sonic Kayaks project sonifies environmental data using simple synthesised sounds whose pitch/frequency change in response to environmental variation in real time. Similarly, our collaborators at Sonic Bikes recently launched the Enviro Bike which sonifies air quality data using the same sound synthesis system.
A nice example of an installation that sonifies pollution data is Mutual Air. This project designed and built a “wind chime” that sounded in response to live readings from a PM sensor. At higher PM concentrations, the intensity/frequency of the chiming increases: