This is an update on the work we've been doing on the climate tool over the last few months. As we move this project from Schroder Foundation and University of Exeter impact funding over to the Blueadapt Horizon Europe project, we have been experimenting with new features and datasets and testing them with our stakeholders (primarily in this case local government officials, people from environmental and health agencies, NHS and other agencies) in regular online feedback gathering sessions. It has come a long way from it's start as a simple Cornwall only prototype, now containing a wide range of different national level data sets.
Climate models
In the original prototype we were using climate data in the form of 24 grid cells that covered Cornwall and a bit of Devon, each sized 25km square, provided by researchers at the University of Exeter. The main aim of the second iteration we've been working on is to scale this up to be able to cope with national data.
Firstly we moved over to national data provided by UK-CRI, an open data 12.5km resolution model that covers the entire UK, comprising 1,711 grid cells. This quickly allowed us to provide national governmental boundaries for people to test, and doubled the resolution of the previous Cornwall data set. Our smallest boundaries are LSOA (Lower Layer Super Output Areas) which are geographic areas based on population - containing, on average 1500 people. The problem is that in many places these are much smaller than the climate 12.5km grid cells, so this is still too low resolution to provide high precision local information.
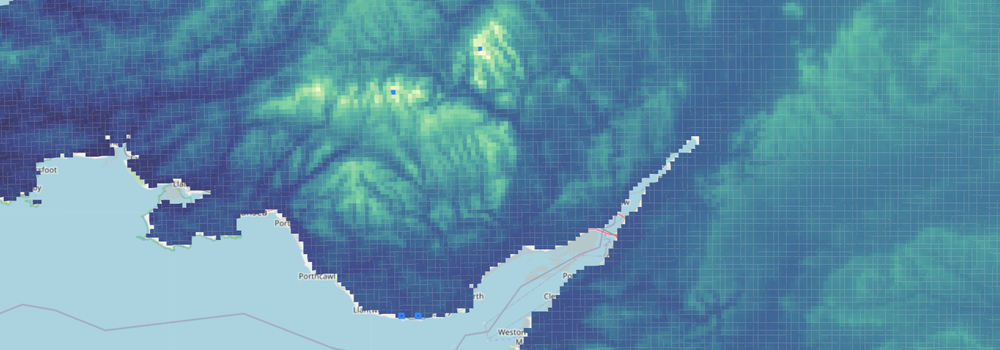
At the end of 2022 with help from the Turing Institute we moved to CHESS-SCAPE, which was our first true test of scalability. This model provides 1km resolution, in total 230,573 grid cells containing data over land from 1980 to 2080. We are also doubling this number by simultaneously using both RCP6.0 climate model (predictions based current policies) and RCP8.5 (worst case scenario) and allowing the user to choose between them. This model comes with a whole host of variables (we are using temperature, rainfall, wind and shortwave radiation - which gives an inverse metric for cloud cover). The downside to CHESS-SCAPE is that it does not include Northern Ireland or Shetland, so we will be replacing this soon with new climate data.
In terms of scalability one of the issues we found was that when selecting large boundaries (usually areas with low population such as the highlands of Scotland) it can easily result in tens of thousands of grid cells that to need to be averaged for all the data variables - which makes the tool slow, and unresponsive for people.
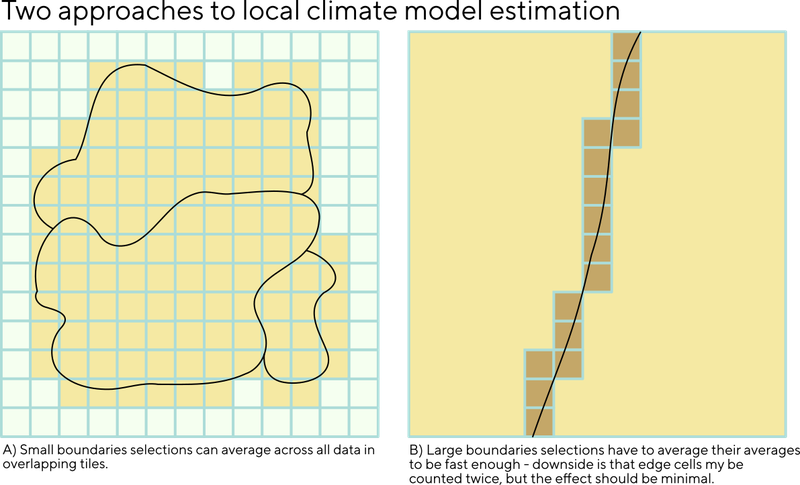
To fix this we use two methods for producing climate predictions based on a user selected region. Method A on the left above is used for smaller boundaries such as LSOA, Scottish data zones and parishes, where the total number of grid cells are small enough that we can calculate the averages across all overlapping tiles. Method B is used for larger areas such as counties and averages the precomputed averages for these regions. This makes it much more responsive for the user, but has the side effect that a small number of overlapping tiles may effectively get counted twice into the averaging process. Given these are such large areas, the effect of this on the accuracy of the data is insignificant.
Climate and health networks
In order to provide a link between the climate data and suggestions for local adaptation measures we have been trialling an approach where we feed the rise or fall in climate change variables for the area the user selects into a network of evidence that attempts to predict localised health impacts. For each problematic health impact we can then suggest adaptations to the user as a list of potential fixes we have the evidence for, which includes case studies as well as the published open access scientific literature that forms the network evidence base.

This is an extremely ambitious approach, and to date it's proven difficult to encompass the quantity of evidence in a way that can provide unambiguous results for a local area. Currently the Exeter team are looking at alternative ways of doing this by checking the climate data (and potentially other geolocated data) directly against each adaptation in turn to provide us with a localised list directly dependant on these variables instead.
Making something that is easily explained and visually checkable is really important - one idea we want to look into more closely is an approach where all information is "reachable" by the user at all times, we may just highlight some areas, and allow people to 'unfold' others - and explain why they are not highlighted. For example by default, measures to prevent flooding can be 'folded' in an area we know is not liable to these problems, but make them expandable with a note indicating that we don't have evidence that flooding is a problem here.
This kind of approach is for addressing the overwhelming feedback that people simultaneously want to see simple answers, but also want to get to the detail that backs it up, should they need to - or have the ability to override our methods and decisions if they know better.
Vulnerability information
Something new in this latest version is that we are starting to include vulnerability information. This originally started as a test to incorporate a open data set from Climate Just, and we found it provided very descriptive and extremely high resolution local information - for example differentiating areas a few streets apart with very different issues.
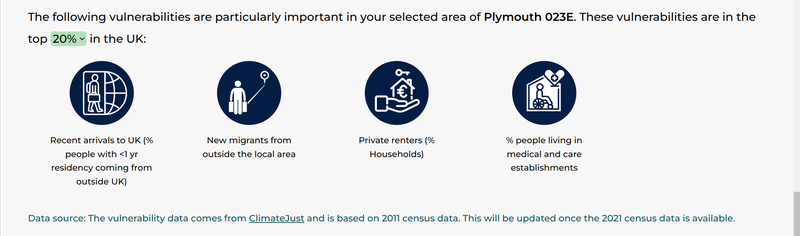
This method of presentation is quite different to the way Climate Just is using the data, and they have been happy to meet with us and are keen for us to be using their data in this way. It's proven very popular with our stakeholders, partly as it reinforces knowledge they already have about their local areas. One big challenge for the Exeter team has been to find evidence for connecting these vulnerabilities to their list of adaptations, so we can show which adaptations are most relevant based on the problems of the people that live there. This project seems to be good at finding areas that require further research - sometimes quite big chunks of work would be needed to address gaps such as this.
Future plans
The next steps all involve incorporating updates to our data sets as they come in. As well as new impact networks from the Exeter team, we are shortly expecting an upgrade to our climate data from Turing Institute with a better (but lower resolution) model which covers the entire UK and uses a more advanced climate modelling technique. We will also be combining this with our Blueadapt partner Euro-Mediterranean Center on Climate Change's data set which focuses on coastal and marine data with variables such as salinity and acidity to develop some coastal focussed adaptations and impacts in the future. We are also expecting a new update to the Climate Just data based on the latest UK census.
Once we have this data incorporated we can start to work on different ways it can be visualised and explored. We can also look more closely at places it can be combined to provide the concise answers that people really want to see.